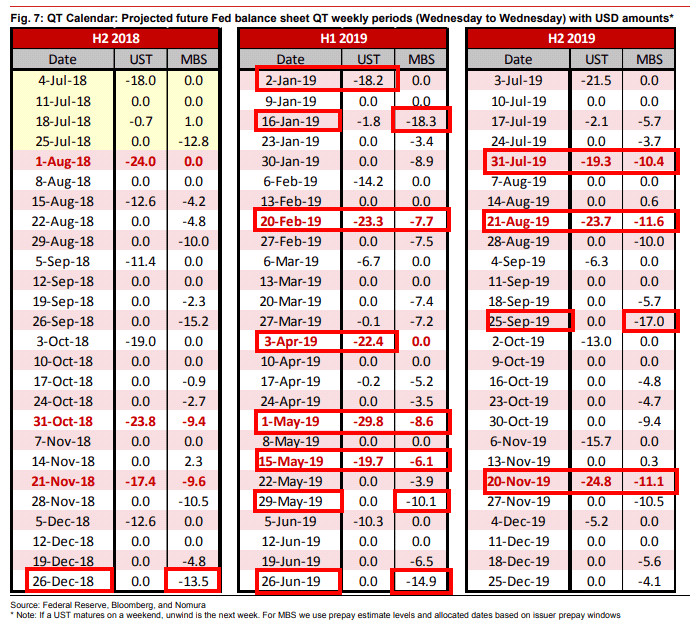
There is a direct correlation between QT days and performance of stock market on those days. The week in which FED does QT are normally negative for US stock markets and we have two big ones coming in January
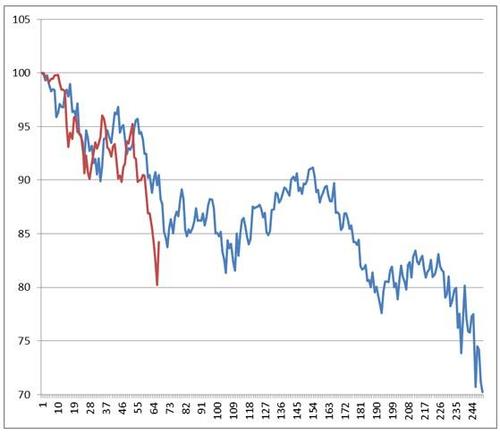
The bear market analog courtesy of McElligott at Nomura. This chart tells the story, while we are in a bear market, we are oversold and odds are the market will spend months consolidating this December 2018 market drop.
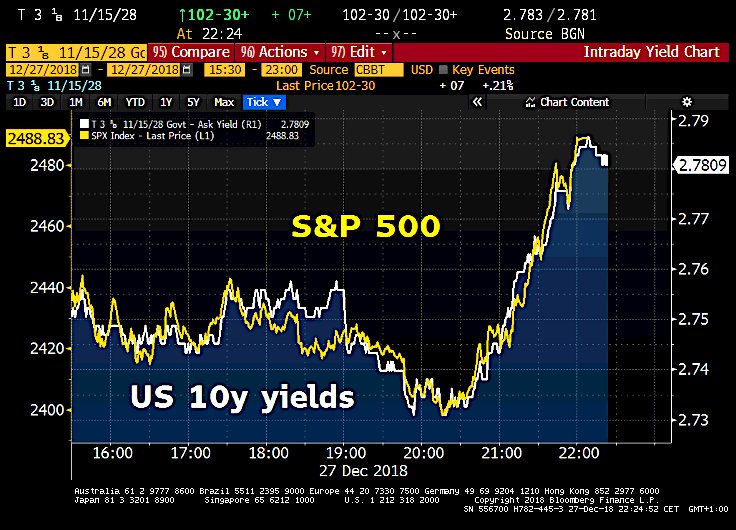
Stocks and bond yields trade in lock-step, suggesting widely anticipated large month-end and quarter-end pension rebalancing flows. S&P 500 erases 2.8% drop in biggest reversal since 2010, while US 10y yields initially had fallen to 2.73% before climbing back to 2.78%.
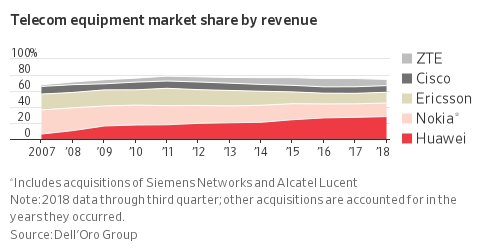
These charts explain how China’s Huawei took over the world