A portfolio containing the despised company stocks outperformed a portfolio of the most admired companies’ stocks by almost 2% per year. Even more revealing: The researchers found that increases in admiration were followed by lower returns, on average. https://www.marketwatch.com/story/youll-love-having-these-hated-stocks-in-your-portfolio-2019-02-04 …

The recession risk over the next 12 months is now a whopping 49%. That is the conclusion judged by a model build on the difference between expectations vs. current conditions in the US consumer confidence data. More in our weekly -> https://ndea.mk/2MPjtRT

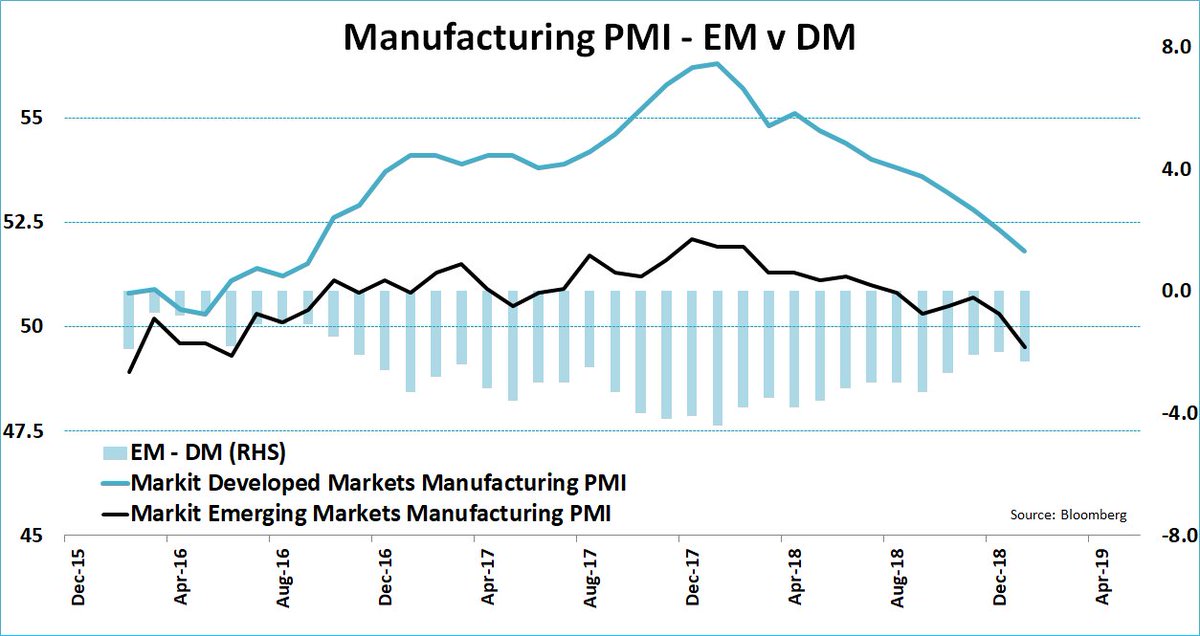
In case you missed it! The EM Manufacturing PMI fell below 50 for the first time since July 2016 in January.
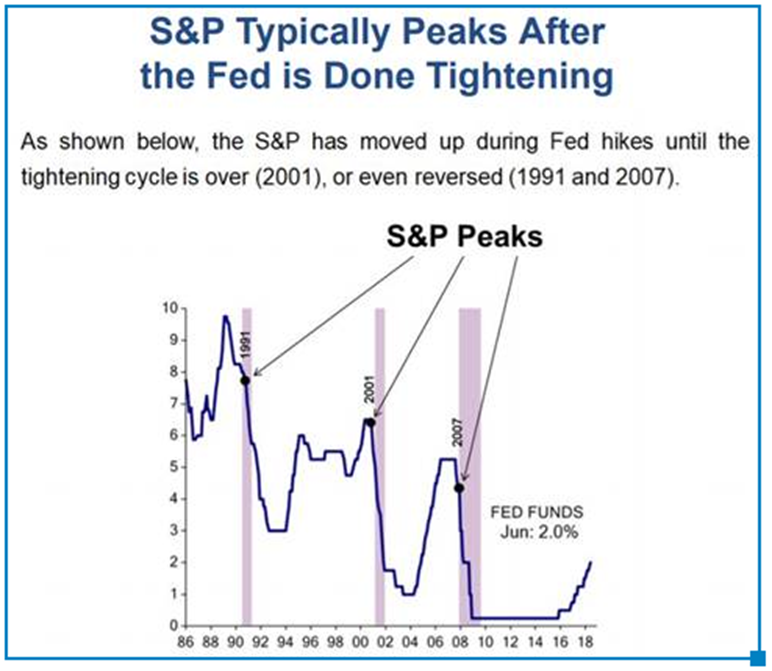
While we get excited about the Fed’s “U-turn,” we should note that the S&P 500 Index peaks after the Fed is done tightening and changes paths and not before. This next chart from Ed Hyman shows us that the last Fed interest rate hike is always the mistake. It shows us that markets peak after the Fed is done tightening and reverses course.