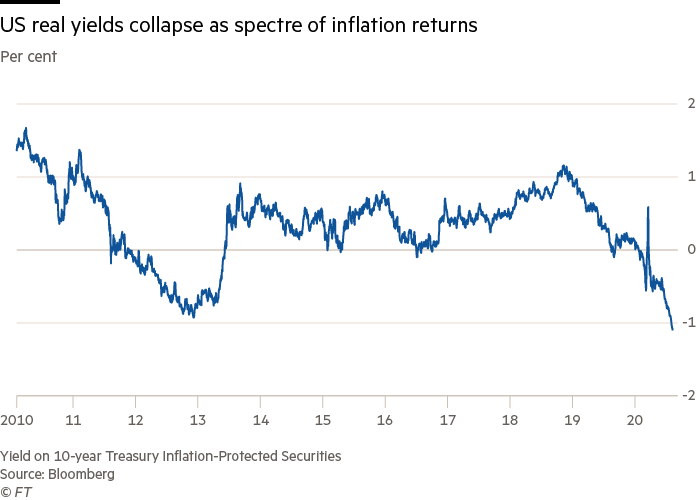
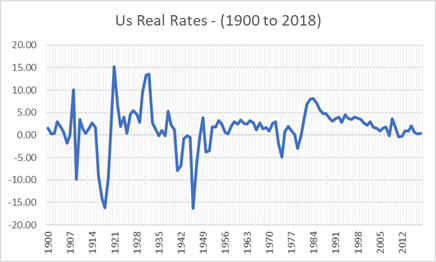
Real Rates (Inflation- Nominal rates) are currently at -1% levels and it seems they may go down even lower. But they have been negative before during the 1940s in the post WW2 Era and in the 1970s STAGFLATION. Decline in real rates sometimes can be a deliberate policy to reduce the Debt burden of govt because the real value of debt falls with rising negative real rates. The policy of negative real rates is always preferred over the bitter pill of allowing companies to go bust .The US policy response post covid has been to print loads to money to reliquify the banking system and avoid defaults. With the rate of US M2 growth reaching 23% , and no chance of increase in policy rates in next couple of years the real rates can fall further in coming years.
When real rates decline, gold’s value tends to go up more because GOLD is a perpetual Zero coupon bond and holding Zero coupon asset with limited supply is better than holding negative real rate asset like US treasury whose supply is unlimited by issuance.Negative real rate also mean that you need to be an asset owner to maintain the purchasing value of depreciating paper currency.
I strongly believe that we are like ( 1942-51 ) headed to -3% to -4% real rates and if that is the expectation on real rates is there a way of mathematically finding the value of GOLD in that environment?
while I was grappling with the question of having an input ( -3 to -4%) value but not the output i.e value of GOLD at that level of negative real rates, there came along an article from the Bloomberg columnist on this subject.
The analysis by Ven Ram(Currency and rates strategist for Bloomberg’s Markets) shows that the duration of gold is 17 when interest rates go up and 20 when yields trend lower, suggesting that the second derivative of the shift in rates is alive and kicking. Back in 2018, Pimco found a duration of almost 30.
Gold has been on a tear this year, having surged 35% in response to a 120-basis point slump in real interest rates. Other catalysts include low global yields; erosion of confidence in global fiat money in general and a weaker dollar in particular; unbridled global monetary and fiscal stimulus; investor purchases through exchange-traded funds in response to uncertainty about the evolution of the pandemic.
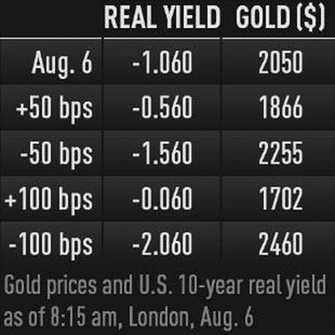
However, the outlook for gold gets murky once it goes to around $2,500 an ounce. Beyond that level, it would imply a massive plunge in real rates and an even sharper rally in breakevens than what we have already seen.
Correlations suggest these factors would also imply a big decline in nominal 10-year yields, which currently sit near 0.50%. Such a move would essentially mean the markets are pricing in a depression-like scenario. Should it play out, the study indicates gold may be propelled toward $3,000 should real yields slump to -3.15%.
Given that gold has a longer duration than linkers, the metal offers a balance sheet-economical way to hedge against inflation.
Conclusion
We believe that US is going to have real rates south of -3% and the time period it is analogous to is the 1940s when real rates averaged -3.14%.
On this basis we believe that gold may reach levels of $3000 and go even higher if real rates go below -4%.
Good article
Inflation- Nominal rates
I thought real rates were nominal – inflation
How do you calculate duration for gold?
Negative real and nominal yields are the result of an increase in money products which decrease the real rate of interest and have a negative economic multiplier. On the other hand, an increase in savings products increases the real rate of interest and has a positive economic multiplier.
Economics is an exact science. Economic prognostications within a year are infallible. Banks do not loan out deposits. Banks create deposits when they lend. The lending ability of the banks is based on deposit circulation, not deposit volume. All bank held savings, $15,000,000,000,000 trillion dollars of savings, are frozen, un-used and un-spent, lost to both consumption and investment. That spells a drop in the velocity of recirculation since 1981 (the end of gated deposits, viz., the monetization of time deposits), or Alvin Hansen’s secular stagnation, or in this case, a stagflationary case (regardless of the asset bubbles). This directly affects CAPEX, as correctly postulated in 1961.
Dr. Philip George’s equation proves Dr. Leland James Prichard’s theory, Ph.D. Economics Chicago 1933, M.S. Statistics, Syracuse ( the ratio of M1 to the sum of 12 months savings ). Link “The Riddle of Money Finally Solved”. As Dr. Philip George points out:
(1) “Holding interest rates down does nothing to boost investment because the problem is falling consumption.”
(2) “When interest rates go up, flows into savings and time deposits increase.”
agree completely
Ritesh, it’s always a pleasure reading your notes. The 215 bps fall from the current 106 bps of -ve real yield with Gold having 20 yrs duration makes gold price closer to $3000 is well understood. Isn’t it based on the assumption that the current price is accurate to the current 106 bps of -ve RR? How do we know that? What am I missing