By Wouter van Eijkelenburg of Rabobank
Summary
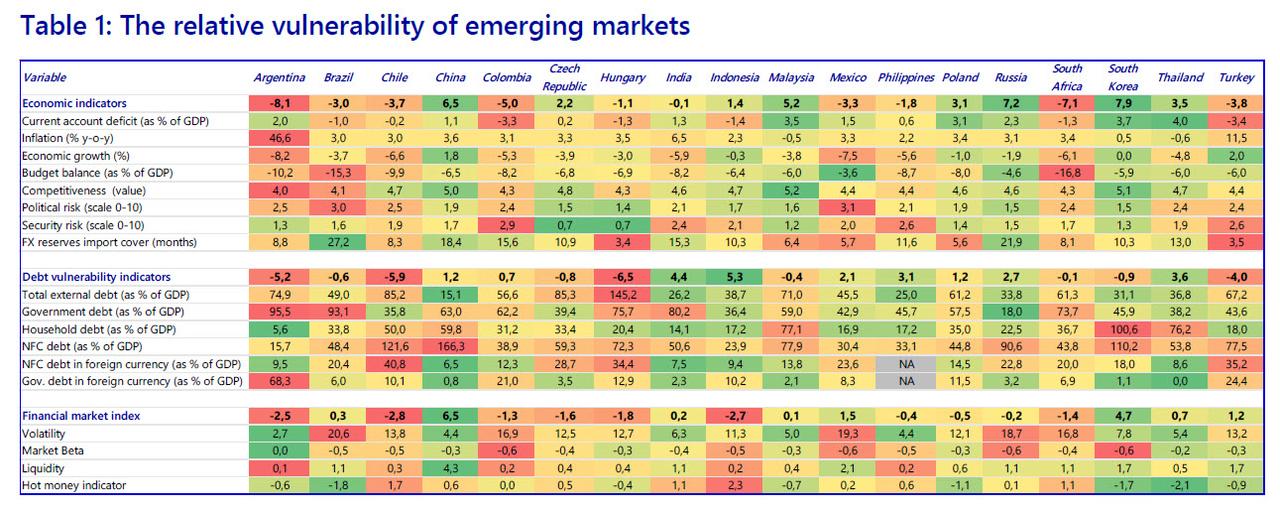
- We have updated our emerging markets heatmap which provides a comprehensive overview of the relative vulnerability of 18 emerging markets
- Asian countries are in relatively good shape, while Latin American countries are most vulnerable, with Argentina ‘topping’ the ranking
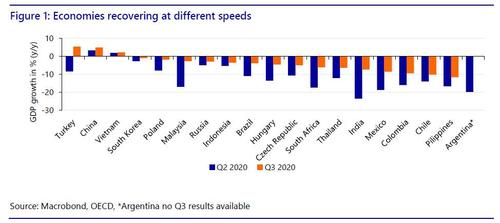
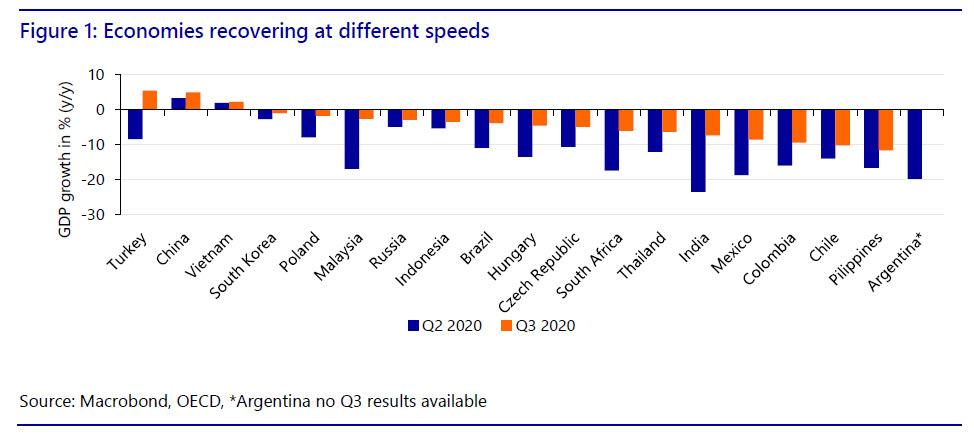
- Emerging markets are recovering at different speeds, ranging from single digit growth (China, Vietnam) to double digit contractions (Chile, the Philippines) in Q3
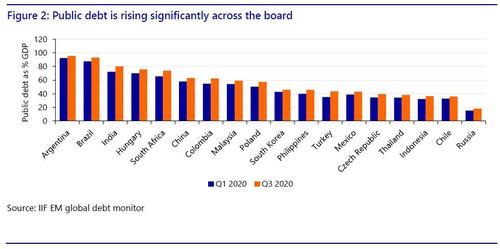
- Public debt levels are surging in all economies, limiting future fiscal space
- In terms of currencies, Philippine Peso, Hungarian Forint and Chilean Peso are outperforming while the Russian Rouble and Indian Rupee are underperforming relative to their vulnerability
- Going forward we expect EM currencies to be relatively strong on the back of a weak dollar and global economic recovery
- But if downside risks materialize, the local currencies of countries that are vulnerable according to our heatmap will be most heavily impacted
The vulnerability of EMs after rollercoaster 2020
Concluding that 2020 was a turbulent year would be an understatement. In light of all recent developments we have updated our emerging market vulnerability heatmap (Table 1) to provide guidance on a range of economic indicators and present the relative performance of emerging markets in an intuitive manner.

Diverging economic recovery
Amid the reverberations of the global pandemic we observe different speeds of recovery among emerging markets. Countries like China and Vietnam showed positive growth figures while countries like the Philippines and Chile are still showing a double digit contraction y/y. Figure 1 presents the fastest growing economy in Q3 on the left and the slowest on the right. The difference in speed of recovery can be attributed to a number of factors. First and foremost, the level of containment of the virus, which, for example, explains why China is doing well (it has been relatively successful in containing the virus). But other factors also play into these developments. For example, countries like the Philippines and Thailand are very dependent on tourism and are hit hard by closed borders. Other countries like Malaysia and China are exporting medical or electronic equipment and could benefit from a rise in demand for these products rose as a result of the pandemic and lockdowns. On the flipside, this implies that countries suffering from closed borders in recent months can expect to rebound quickly whenever vaccines are widely available and international travel returns to pre-pandemic levels.
Rising debt levels
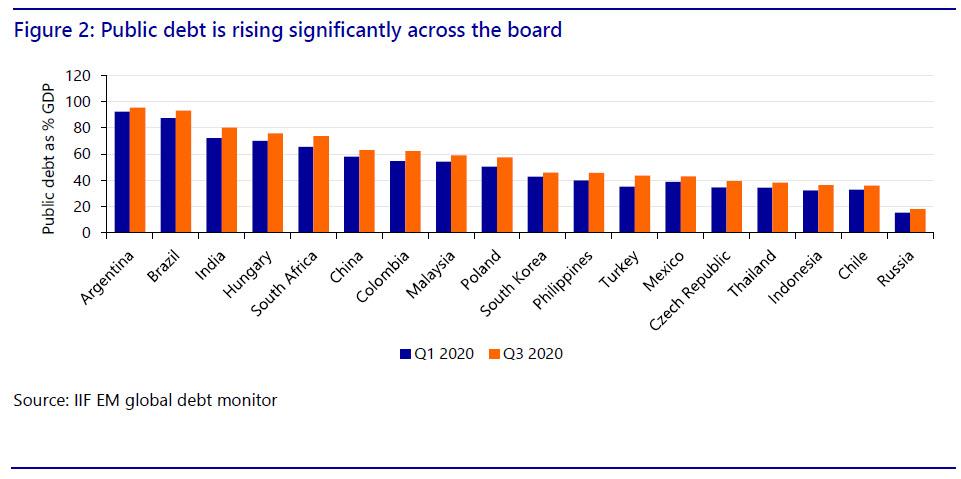
In order to limit the impact of the pandemic, governments reacted with large stimulus packages. In an earlier publication we elaborated in depth on COVID-19 monetary and fiscal stimulus packages among developed and developing countries. The additional fiscal stimulus has resulted in large increases of public debt. In Figure 2 we see the countries with the largest public debt as a % of GDP, ordered from left to right. Countries that stand out are Argentina, Brazil and India. These countries have increased their public debt as a result of large fiscal deficits in order to finance COVID-19 support packages: Argentina 6% of GDP, Brazil 8.4% of GDP and India 8.5% of GDP. Going forward, limiting large budget deficits helps governments to keep the public debt level sustainable and retain fiscal headroom to stimulate the economy if needed. High debt levels are a constraint to future economic growth. They limit future fiscal spending for a number of reasons: i) A higher share of the government budget needs to be allocated towards debt repayments and cannot be used to stimulate the economy ii) higher debts lead to higher default risks and iii) higher debt levels could increase interest rates on future government bond issuance.
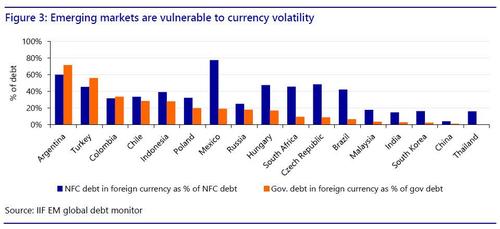
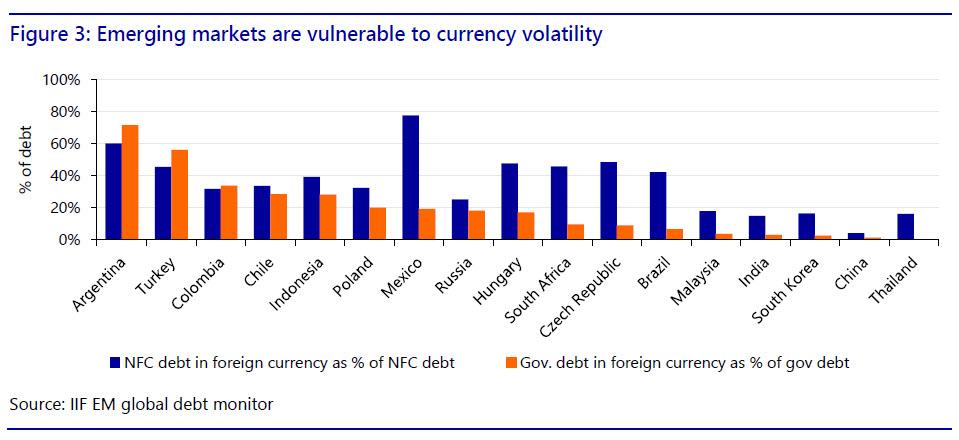
Another important measure is how much of the debt is denominated in a foreign currency. Large shares of foreign-currency denominated debt increase the vulnerability to currency volatility. In Figure 3 we observe that Argentina, Turkey and Indonesia have the largest share of their debt denominated in foreign currency, which makes them the most sensitive to currency movements within their region. This dependence on foreign capital constrains the set of monetary or fiscal mechanisms that can be used to stimulate the economy. For example, cutting central bank interest rates depreciates the local currency, indirectly increasing government debt levels in terms of the local currency. On the other side of the spectrum we see that mainly Asian countries (Thailand, China, South Korea) are in good shape with regard to foreign currency-denominated debt.
Overall rankings
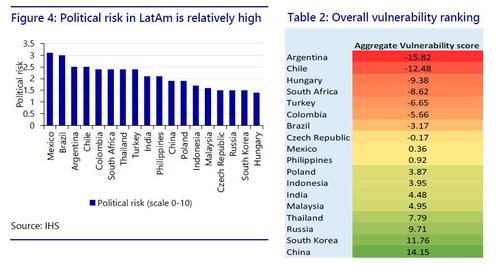
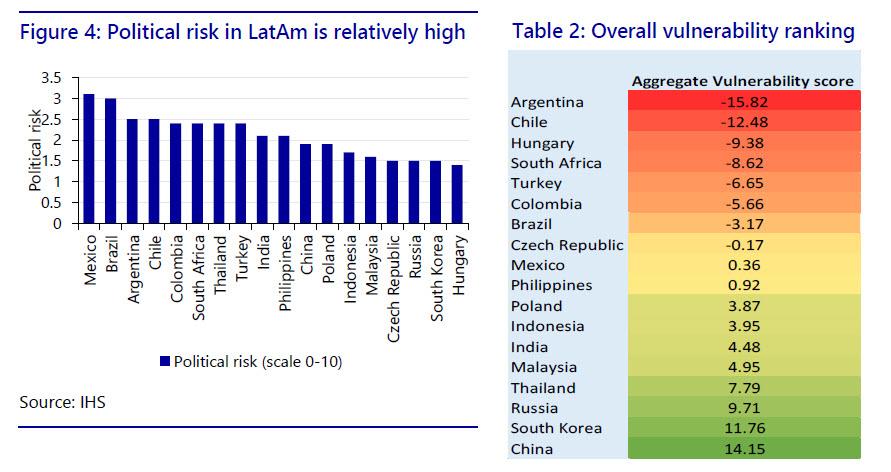
In Table 2 we show the aggregated rankings. The countries shown at the top are the most vulnerable according to our framework while countries at the bottom are least vulnerable. In general, we observe that Asian countries are performing quite well, while countries in Latin America are showing a higher degree of vulnerability. We already showed (Figures 2 & 3) that countries like Argentina, Turkey and Chile are relatively vulnerable with regard to their debt levels. At the same time, the Philippines, Chile, Colombia and Mexico are struggling to rebound from the economic dip caused by the pandemic. Alongside economic performance, institutional quality is another driver.
Zooming in on institutional indicators like political risk we note that Latin American countries are more vulnerable than countries in, for example, Asia (Figure 4). However, these are all relatively low with the highest score being around 3 on a 0-10 scale.
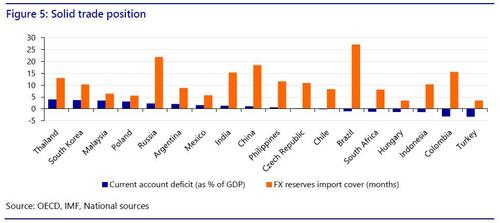
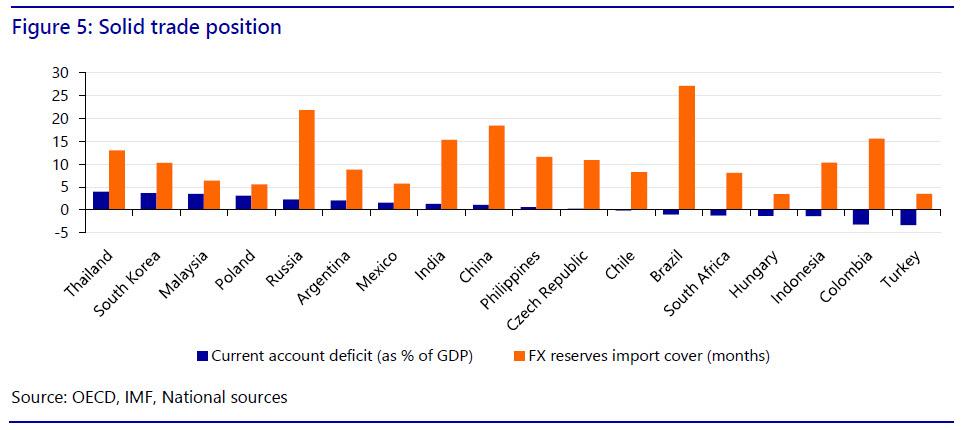
Finally, trade figures provide another important economic indicator. Figure 5 shows which countries have the largest trade surplus left to right and the vulnerability with regard to FX export cover, which indicates how many months of imports can be covered by current foreign reserves. The figures point out that a relatively solid trade position supports to a country’s relatively good position in the overall rankings, especially in the case of Thailand, South Korea and Russia.
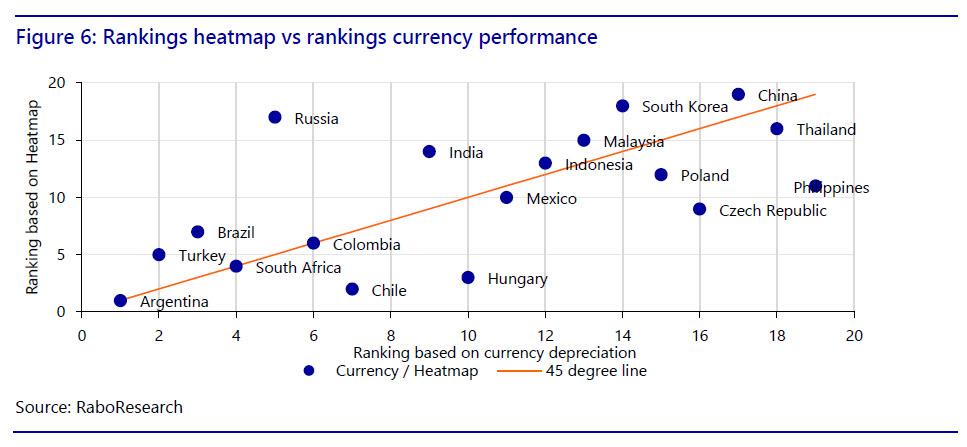
Vulnerability heatmap vs. performance of local currencies
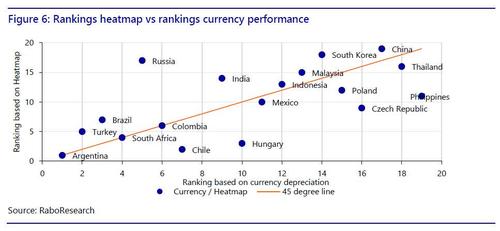
In figure 6 we compare the vulnerability rankings to the performance ranking of the local currencies since the start of 2020. Overall, we observe that the vulnerability is a good gauge of the relative performance of the local currencies. There is a decent fit between the vulnerability and depreciation of currencies. Currencies above the 45 degree line are relatively underperforming based on the relative vulnerability ranking, while currencies under the 45 degree line are relatively outperforming their relative vulnerability ranking. Although these indicators provide a comparison based on fundamentals, other very important factors must be considered when evaluating the value of these currencies, for instance current local economic circumstances, global events and global investor sentiment. In this way, the Philippine Peso’s strength can be attributed to the increase in remittances and collapsed imports during the pandemic and recovery from strong typhoons in November. The Rouble’s weakness could be attributed to foreign policy risks and associated risks for investors, constraining them from investing in Rouble-denominated assets.
The year ahead
The vulnerability heatmap provides an intuitive framework to assess the fundamental performance of emerging markets and their relative performance on a range of indicators. But we should not look at these in isolation. Next year the individual performance will be driven by economic recovery, virus containment, political stability, budget prudence and central bank policy as well as global investor sentiment.
In general, emerging market currencies have the opportunity to appreciate on the back of a weak dollar, as a result of ample liquidity provided by the FED and ECB. In turn, this provides governments and central banks of EMs to loosen their policy in order to stimulate their economies. The divergence in monetary and fiscal policies will be one of the main drivers in relative performance of the EM local currencies.
The economic recovery, spurred by the implementation of vaccines is another important factor. EMs will benefit from developed markets opening up, increasing the global demand for products and commodities, which will benefit production countries like China and Malaysia and commodity exporters like Indonesia and Brazil. Likewise, opening borders to tourism will benefit countries like the Philippines and Thailand.
On the flipside, downside risks like new outbreaks or a shift towards risk-averse investor sentiment will have a more severe impact on currencies of countries that are most vulnerable according to our vulnerability heatmap. Countries that are least vulnerable according to the heatmap will be less impacted by negative events and a risk-averse investor environment.