By Charles Gave December 25, 2020
THE BOOM OF 2021 BY CHARLES GAVE
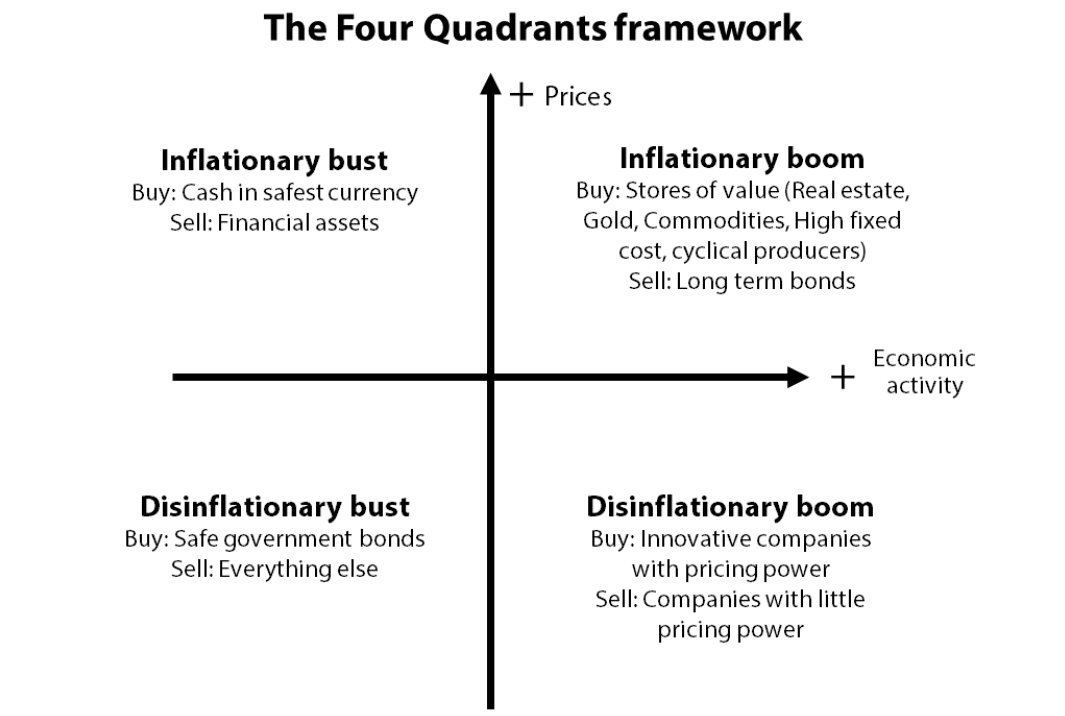
Many readers will be familiar with my four quadrants representation of macroeconomic conditions, which like most Gavekal research is backed by impeccable logic. The tricky part, as ever, is linking the conceptual insight to current market conditions. To put it simply, the questions I want answered are: where are we today and where are we likely going next?
Needless to say, I have worked on such questions since authoring the tool back in 1978. Over the years, I have come up with a few answers ranging from the straightforward to the rather complex, as expounded on in my 2016 book investigating Wicksellian analysis.
Back to MV=PQ
In this paper, I want to show that using tried-and-tested tools, which have not changed since they were built, I can, indeed, pinpoint where we are, and where we are going. Longtime readers will know that I place emphasis on the old equation MV=PQ, except that I consider V to be an independent variable, and not the result of the ex-post tautology V=PQ/M.
They may even recall that around the turn of the millennium, I developed a leading indicator for Q (growth in volume), for P and for V, while M (M2) is provided to me by the Federal Reserve. Hence, a logical solution to my problem of mapping where we are in the four quadrants should be possible.
My growth indicator will tell me whether we are on the left or right side of the four quadrant representation, while my P indicator will give indications of whether we are in the top or the bottom halves. And the V indicator should tell me whether interest rates are going to rise, or fall.
Let’s start with the US growth/recession indicator, shown below, which incorporates mostly economic data.
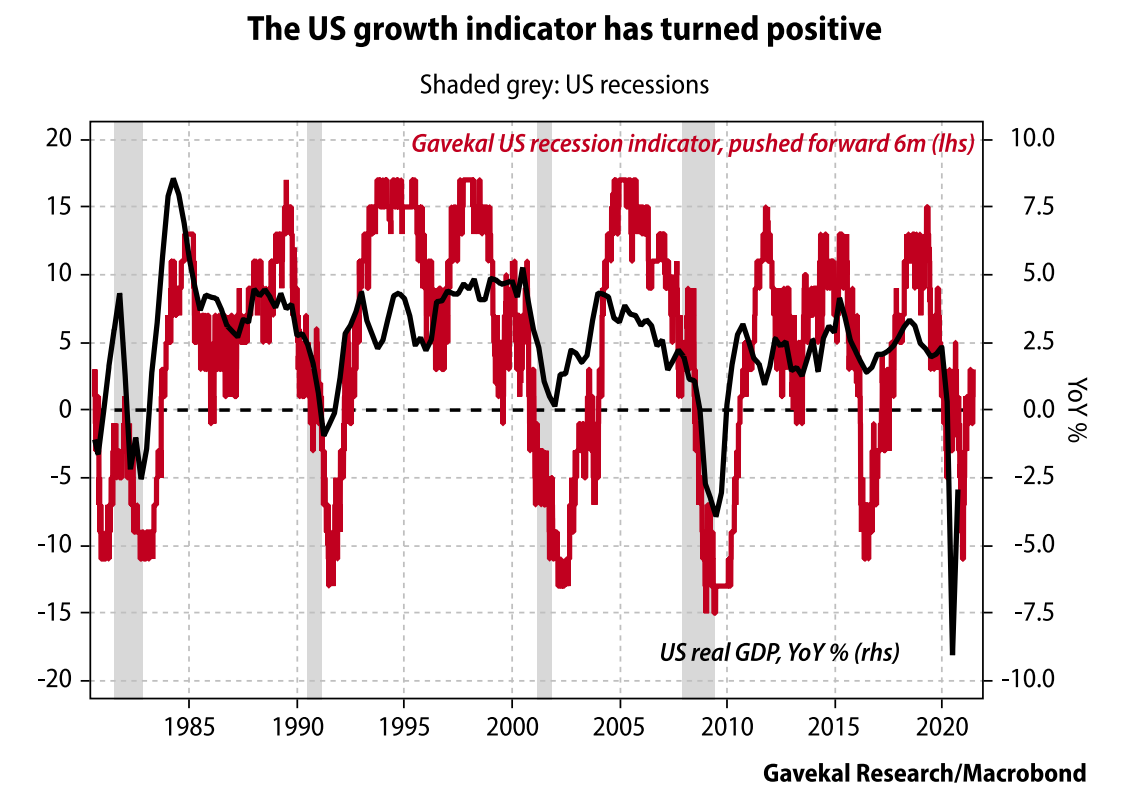
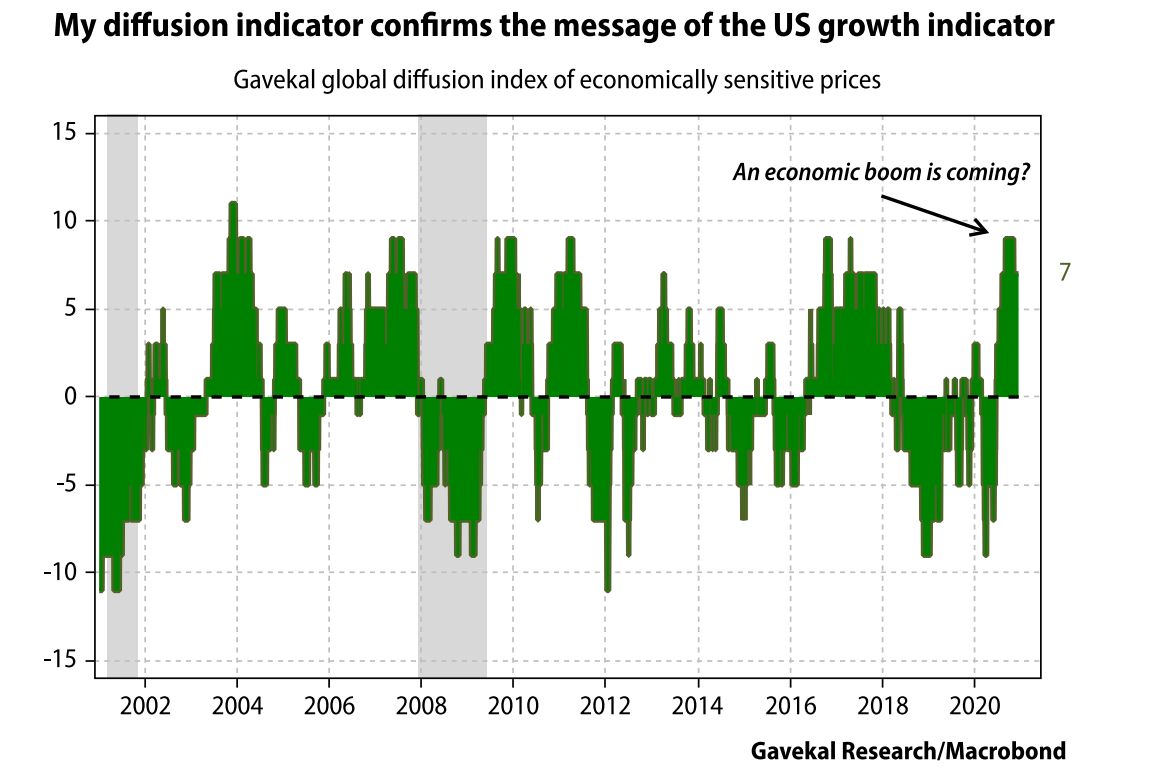
The indicator collapsed at the end of 2019 and the early part of 2020, but has now returned to positive territory. This reading suggests that the US recovery will continue, which is supported by my “control” tool— a diffusion index of economically sensitive prices—which incorporates only market prices. The diffusion indicator is telling me that a boom is coming in the US, which confirms the message of the growth/recession indicator that a US recession is highly unlikely in the near future.
And thus, I can safely assume that we are on the right side of the four quadrants; either in an inflationary growth period (top right) or in a disinflationary boom time (bottom right).
Having established that the US economy sits in the right side of the quadrant, I feel fairly sure that its precise position is in the upper (inflationary) quadrant as my “P indicator” of inflation has shot up.
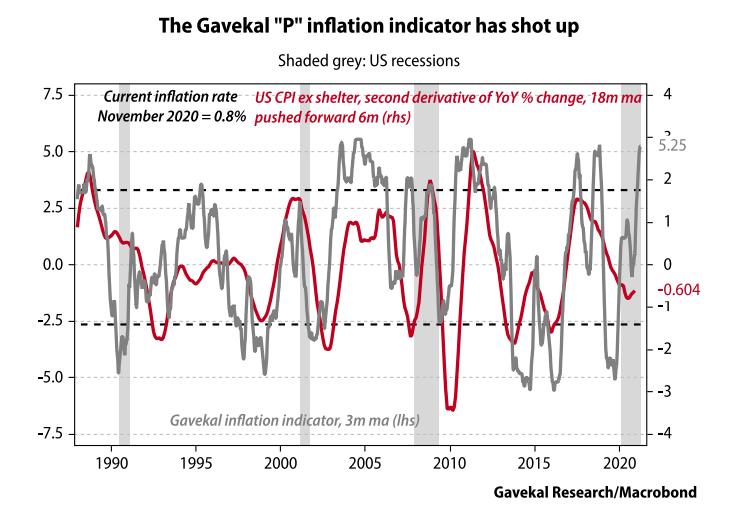
In the chart above, the P indicator is compared to the second derivative of the US CPI (ex-Shelter). Why the second derivative? Because what matters for financial markets is not the actual inflation rate but the “surprising” changes in this rate, either up or down. And surprises may be coming. The P indicator seems to expect, one year down the road, a rise of at least 200bp in US CPI, which would take it close to 3%, versus 0.8% today.
In summary, my indicators tell me that US growth will be strong and we are on the right side of the four quadrants framework. As prices seem set to accelerate, we are moving into the upper half, which means that 2021 should see an inflationary boom in the US.
The velocity of money turns up
This brings me to the velocity of money, V, and to the reaction of the central bank to the US entering an inflationary phase. The amount of money injected into the US economy in the last 12 months has been stupendous. As a result, V has collapsed as never before. But most of this money is still in the accounts of economic agents (the Treasury, individuals, and companies) and is apparently starting to be used. As a result, velocity is starting to rise again, but I will know for sure by how much only with a considerable lag, due to the time needed for GDP data to be compiled.
So, I need a tool to give me some “lead” on the likely direction of economic velocity. This is why I built the Gavekal Velocity Indicator using market-based data that gives a heads-up as to whether what I call economic velocity (PQ/M) is about to turn up, or turn down. The chart is shown below.
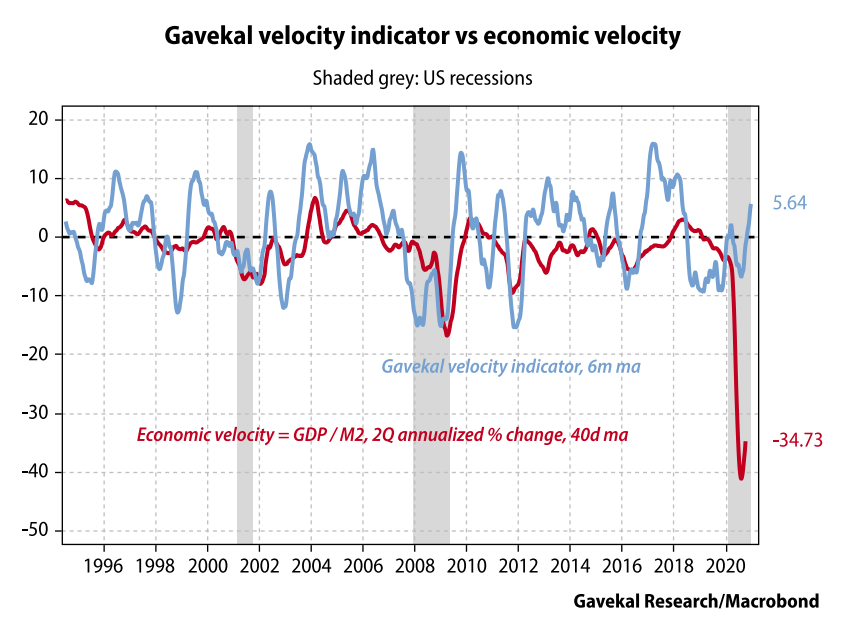
The GVI—which is supposed to lead actual velocity by six months—“turned” up at the beginning of September 2020 and is now positive. This implies that cash balances held by economic agents are starting to move into the real economy. It confirms that activity is accelerating.
I have argued before that if the velocity of money is rising, demand for money must be growing faster than the supply of money. This implies that the price of money—the interest rate—will rise. What could upset this logic would be the Fed continuing to print, so that M keeps rising. If this happens, it goes without saying that the US dollar exchange rate will fall big time.
Conclusion
- Economic activity is going to be strong, to very strong, in the near future.
- Inflation is going to accelerate significantly in the next 12 months.
- Yields on 10-year treasuries will rise from an abnormally low level to a more normal level, implying a gain of about 200bp.
- If the Fed tries to stop rates rising, the US dollar may collapse, which will be inflationary for the US and deflationary in Europe.
In short, the US is moving from a deflationary boom to an inflationary boom. A wrinkle could be a big rise in the oil price, which would make the situation difficult for the Fed, as it was in 1973. In past inflationary booms, non-US markets, especially in Asia, tended to outperform the US, while the dollar usually fell. Hence, investors needed to own gold and long-dated bonds in currencies which were due to revalue strongly (deutschmark and Swiss franc in the 1970s) but large cash positions also had to be held in those currencies.
My advice today is to replace bunds with Chinese government bonds and hold cash in Asian currencies, which are tracking the renminbi. As an aside, Brazilian bonds and cash tend to offer exceptional returns and could be put in the aggressive part of the portfolio as a replacement for equities.