The risk-free rate is very low. As the joke goes, the risk-free return has turned into return-free risk.
How Global Markets have moved in 2021?
- Total assets of the five major central banks (Fed, ECB, BoJ, PBoC and BoE) rose from at an average annualized rate of 32% for each of past two years.
- US M2 money supply has increased at an annualized rate of 20.2%, for nearly two successive years, and now stands at over 90% of GDP, having started the millennium at 44.4% of GDP.
- Resultant effect of excess liquidity – Global inflows into equities have surpassed $1tn in the past year, exceeding the combined total from the past 19 years – Goldman

US takes the cake in Equities
U.S. was the winner amongst major nations attracting maximum investor inflows; clearly driven by massive liquidity infusion and recycling of flows to equities in a negative real rate environment.

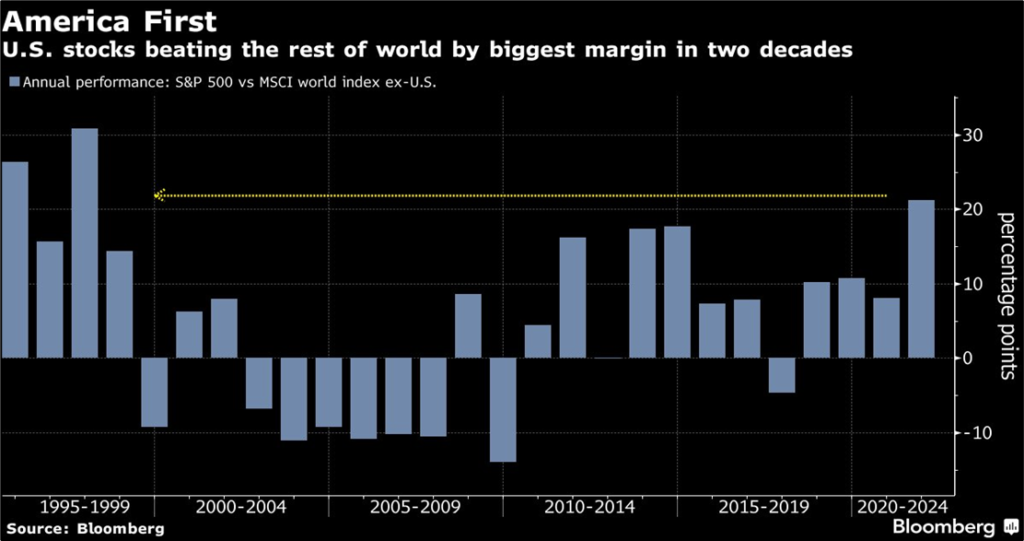
US stocks are beating rest of world by most in 2 decades. The S&P 500 has surged 25% YTD compared with 3% gain from the MSCI All-Country World ex-US Index.
Capital misallocation at its highest level
Excess liquidity is keeping the zombie companies alive

There is a twist in the tale
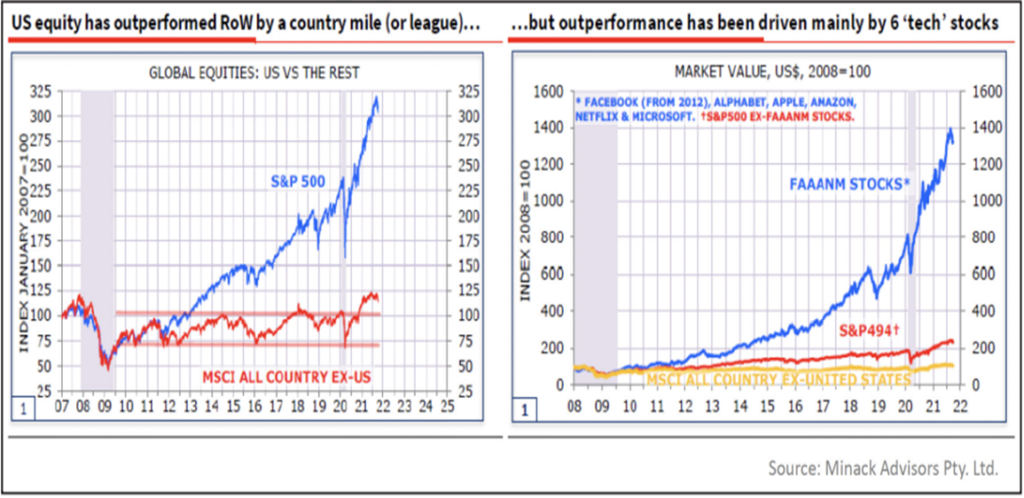
The U.S. equity market has outperformed the rest of the world dramatically, since the last peak of 2008 on an index basis. It has gone from 100 to over 300. Whereas the world index just went from 100 to about 115.
Here comes the differentiator – FAAANM (Facebook, Alphabet, Apple, Amazon, Netflix and Microsoft) stocks from early 2008 onwards have gone up 14-fold; whereas, the other 494 S&P 500 stocks went up from 100 to 215. World markets haven’t seen anything like it and not even Japan was as excessive.
Money (excess liquidity) moved into US tech rather than US Government bonds
What happened to SPX back in 2018 when real fed funds went positive? After peaking in Oct’2018, markets corrected ~17% till Dec’2018 in response to rising real interest rate.

……but with a pinch of salt
Historically, U.S. Treasuries (USTs) have been the go-to asset of foreigners to hedge global portfolios in/for turbulent times. In March 2020, this was violated and since then foreigners continued to sell USTs. Infact since 3Q14, foreign/international investors have stopped buying sufficient USTs, buying only ~$900 billion of $11 trillion in UST issuance in that time.
So, what changed the world to move away from ‘risk free asset’ (or call it return free risk)
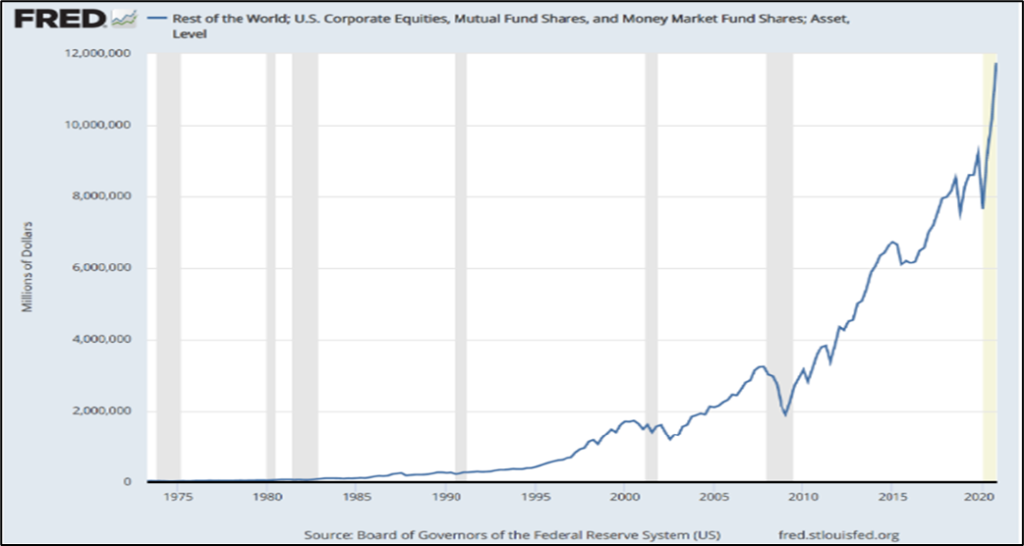
Global Central bankers (to manage reserves) have been turning to new (riskier) investments to compensate for collapse in bond yields. Historically, foreigners bought USTs to sterilize USD outflows & maintain currency stability; but in recent years (specifically post 2020 UST illiquidity crisis), they’ve started switching to U.S equities to sterilize USD outflows.
Making it an extremely volatile and negative yield for Bond holders
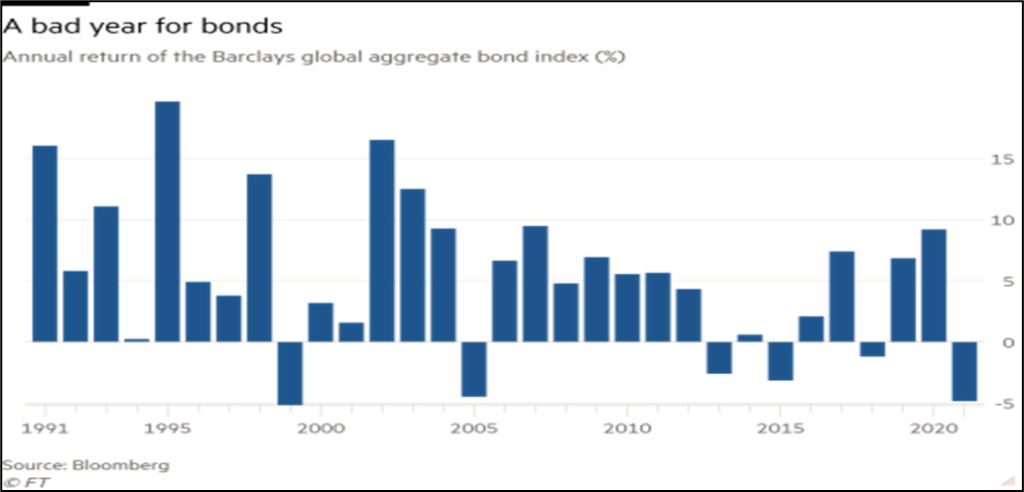
Barclays global aggregate bond index: -4.8%. Treasury investors are losing more money than they have in four decades since 1980s, once inflation is taken into account.
Except China – China takes the cake in Bonds
China is the only major country with positive real interest rate attracting savers since past 2 years. But this is turning to be a nightmare for borrowers/corporates/developers with interest outgo more than the inflation in a looming Debt scenario, leading to defaults. ‘Positive Real rates leads to defaults.’
Is this leading China into easing policy rates?

Still wondering ‘Why’ were markets so strong this year?
Europeans have recycled almost half trillion in US stocks

What will normalize these fiery markets?
Strong markets have been supported by higher margins. As liquidity tightens and low-cost inventories runoff, we should see margins normalize.

‘INFLATION’
US saving rate is now at pre pandemic levels of 6%. Rising supply side driven inflation coupled with drop in cash reserves has vast implications for the working class and could dampen consumer spending, a large share of economic activity/GDP.
Good Inflation = Demand driven; Bad inflation = Supply driven
Higher inflation is a politically unacceptable scenario, pushing central bankers to expediate the pace of rate hike.
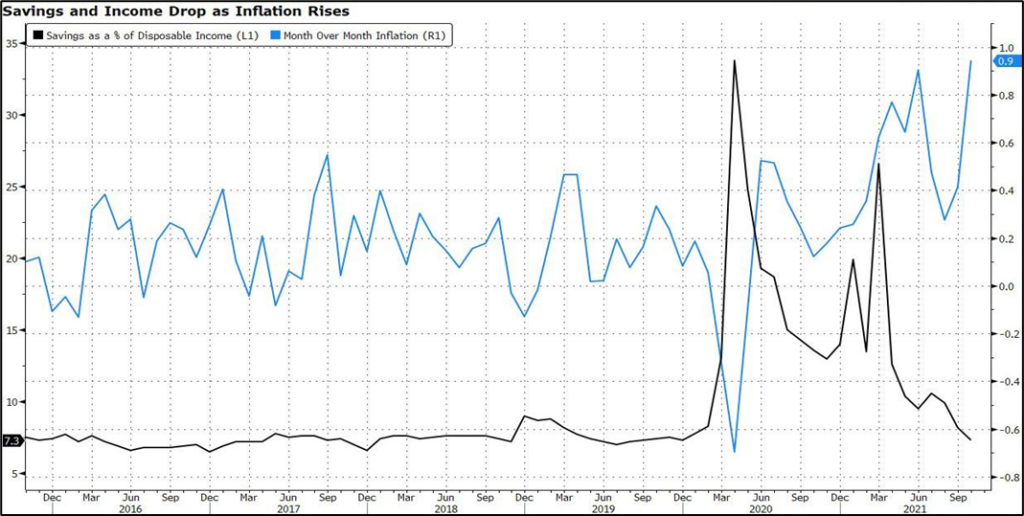
Inflation is moving from financial assets to real economy
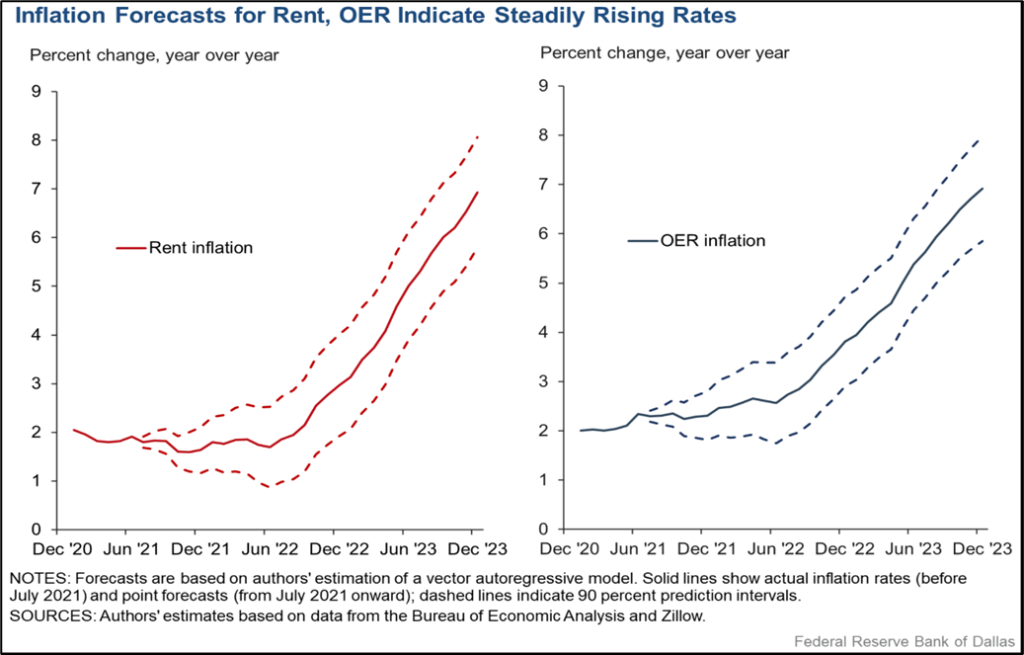
Headline inflation might soften next year but Core inflation will keep rising. This is important as core inflation is considered a prime indicator of underlying long-term inflation and impacts rising prices on consumer income & investments. Dallas FED just predicted 7% Rent inflation by 2023. Rents are 40% of US CPI index.
Ultimately, it’s all about ‘Liquidity’ flows
Only thing that will vary amongst nations is the quality of liquidity added to the system.
China easing at a time when world markets are tightening will add “responsible” liquidity and US will withdraw liquidity given inflation fears. This tale of reversing tables will drive volatility across asset classes in the quarters ahead.

What if Liquidity turn into Headwind from Tailwind
Liquidity projections of Central banks warn of a Sharp slowdown in 2022 led by tapering and eventually translating into rate hikes.

Leading to liquidity situation dramatically different from that seen in 2021
US treasury spend $1.5 T in 2021 by drawing down on cash balances. In 2022, they will rebuild their balances to $500 B. That means they are going to soak out of the system about $400 billion.
A renewed dose of QE or a ‘Powell Put’ seems the inevitable remedy for the next stock market sell-off. In short, future growth of global liquidity has seemingly become institutionalized by these debt burdens.

Divergence amongst Central Bankers on Monetary policy way ahead
Significant differences between the US and Eurozone, could open up major policy divergence between Fed and ECB policy over the coming years, with the fed funds rate rising; while, the ECB is not expected to raise interest rates and continue liquidity easing. Interestingly Japan has been growing at the pace of economic output since Sep 2020.

BOJ and Fed have started to flatten out. ECB will start flattening by second half of 2022.

Emerging Markets’ vulnerability to Fed tightening
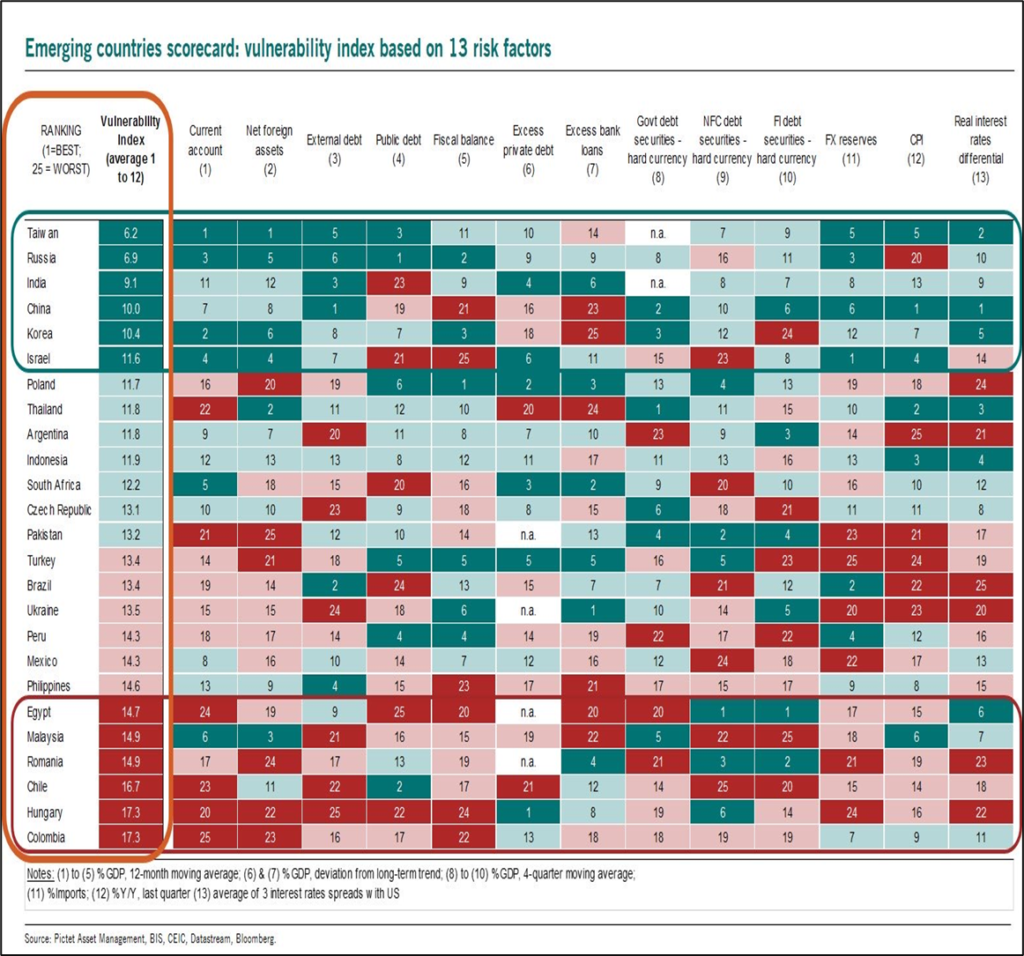
Markets globally get affected when the interest rates are hiked in the US. Amongst all major Emerging markets, India seems to be fairly insulated on the basis of vulnerability index.
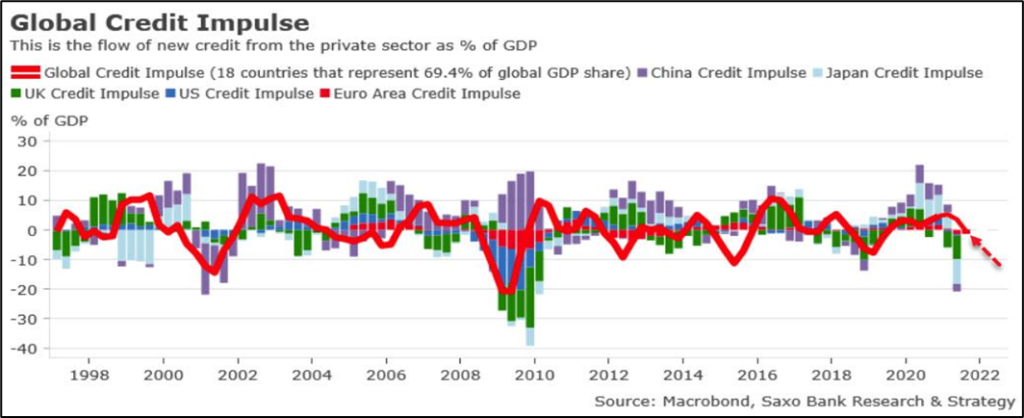
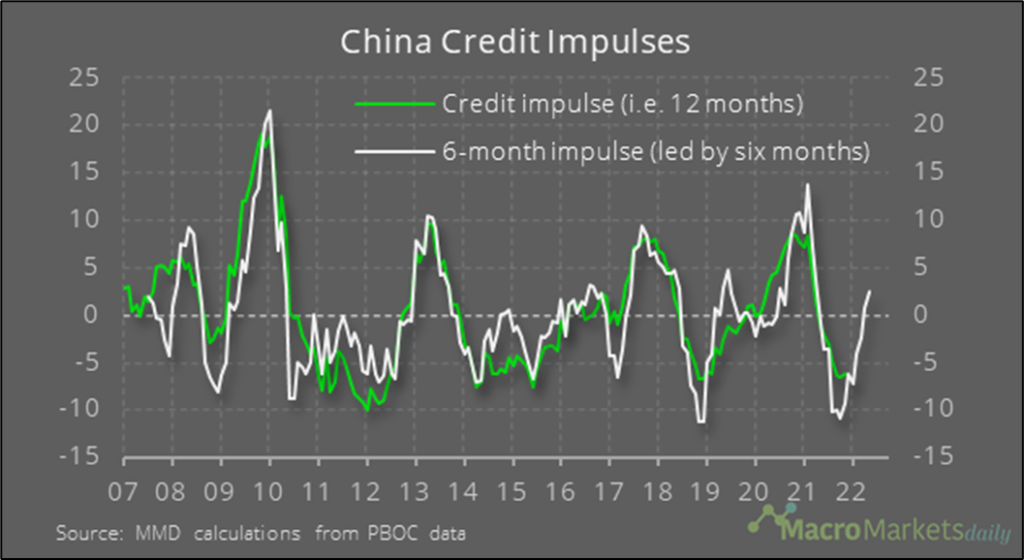
In an era where most economics are tracking a negative Credit impulse
The global credit impulse is now in contraction territory, running at minus 1.3 % of global growth (Saxo bank). When the credit impulse is negative, expect that growth will cool down significantly in the next six to nine months afterwards. Will we see turnaround in credit cycle for countries like China, Japan etc.?
China is slowly showing ray of hope: Positive expected Credit impulse + Monetary easing = ‘Growth’?
Bloomberg’s China Credit Impulse finally ticked higher this November. PBOC has started easing monetary policy and pledged healthy credit growth rates; which is expected to reflect on Global GDP. There is a strong correlation between credit impulse and investment growth, the rise in credit impulse may help push the growth of real investment in the near future.
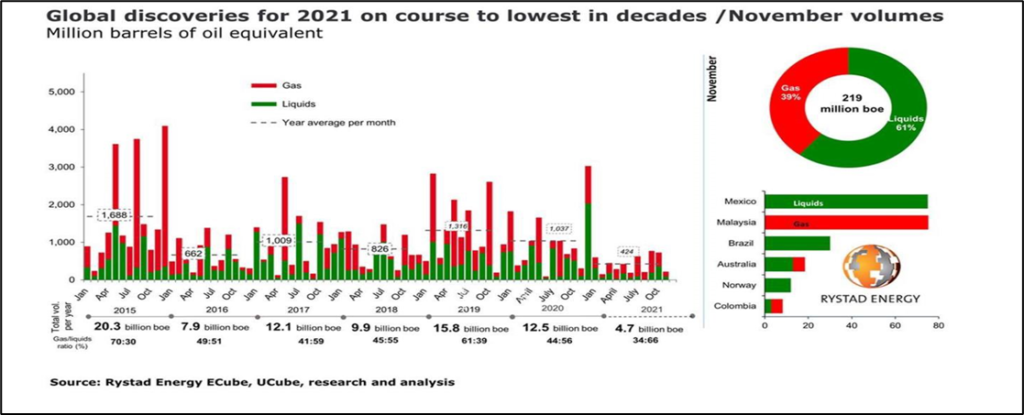
With rising Oil prices acting as a major headwind to global growth
2021 sees oil and gas discoveries sink to lowest level in 75 years. Supply constraints will lead to higher energy prices. Saudi Arabia said global oil production could drop 30% by the end of the decade due to falling investment in Fossil fuels. The resultant could be an ‘Energy crisis.’
What could lead Oil to $200 by 2024? The rise will not be demand driven but due to supply side/productivity issues. We have had a 12-year bear market in commodities, and therefore we have had a tremendous underinvestment, leading to structural shortage in supply.
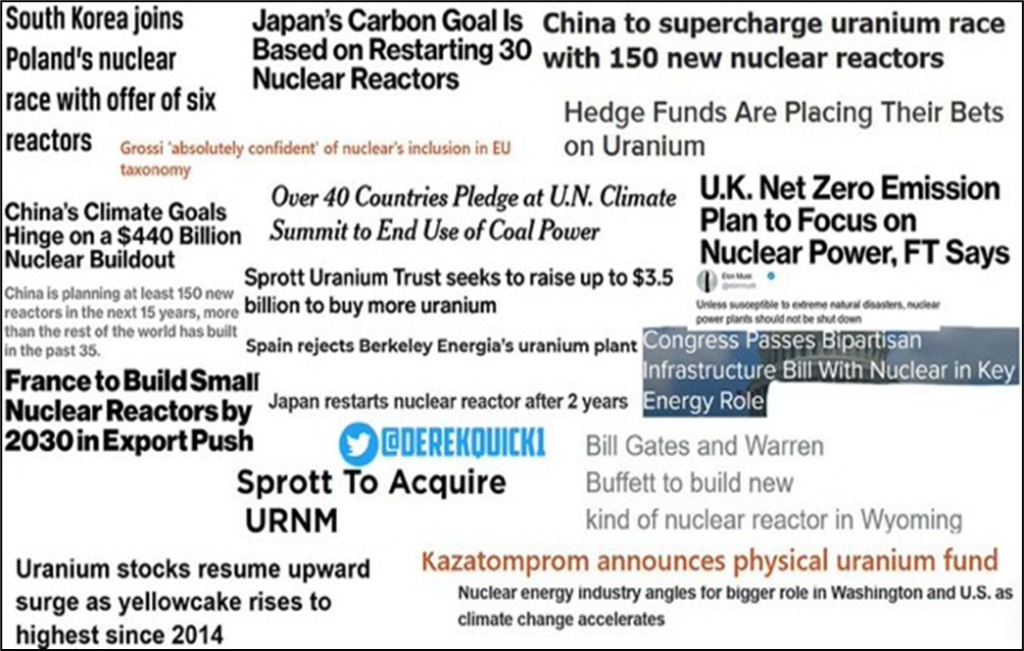
And continued Shift of focus to Clean & Green Energy as an Investable Asset
Europe will most likely be adding nuclear energy in its Taxonomy
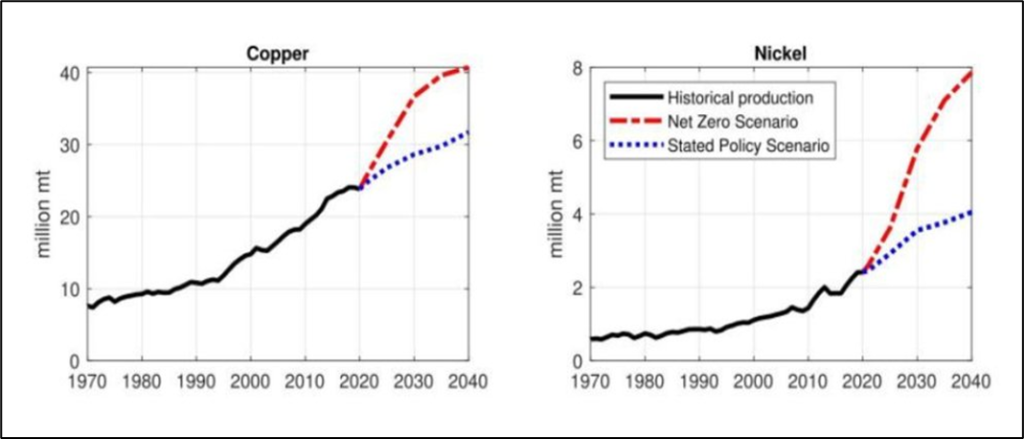
Providing impetus to demand prospects for Copper & Nickel under Net Zero Emissions scenario
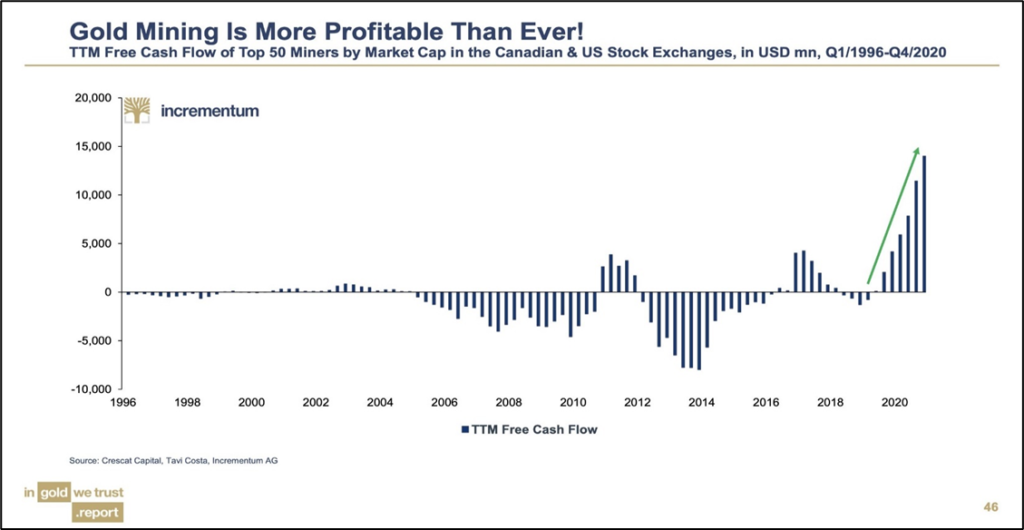
In a separate world, Gold continues to shine…atleast in cash flow terms
Gold miners are producing higher free cash flows than ever. Will be lead to increased buybacks or dividend prospects?
Global Markets Outlook
- Inflation has emerged as the key risk for the global economy. Inflation, it said, has clearly been more persistent and more broad-based than what the Fed and most market participants, had anticipated it to be. This has led to increasing market expectations that monetary policy globally is set to become tighter.
- Global liquidity situation will be interesting to watch as central bankers tighten in response to inflation fears and China goes for ‘responsible Easing’ liquidity scenario.
- Volatile H1 2022 with chances of drawdown exceeding 10% as Central Bankers try tightening the Liquidity. 1st half of 2022 may witness low growth in global GDP with recovery being witnessed in the 2nd half given strong baseline effects.
- High growth stocks to underperform in a US rate hiking cycle with inflation scares leading to investors rotate away from high-multiple tech stocks and into sectors that hold up better in a rising rate environment. Those include financials, energy and consumer goods, as well as industrials and real estate.
- Corporate bond spreads and Emerging bonds will start underperforming US bonds due to Fed Tapering.
- As base line inflation effects fades in 2022 and GDP growth flatlines, one might see Fed tempering its Hawkishness in response to low growth.