Why currency risk matter more than Interest rate risk

The Mumbai Ahmedabad bullet train deal done six months ago with 88000 cr loan from Japan was done in their base currency which is JPY, but at a nominal interest rate of 0.1% for 50 years. The exchange rate was 57 paisa for 1 JPY at the time of signing the deal. The deal emphasised more on the nominal interest rate which India would be paying and not on exchange rate .

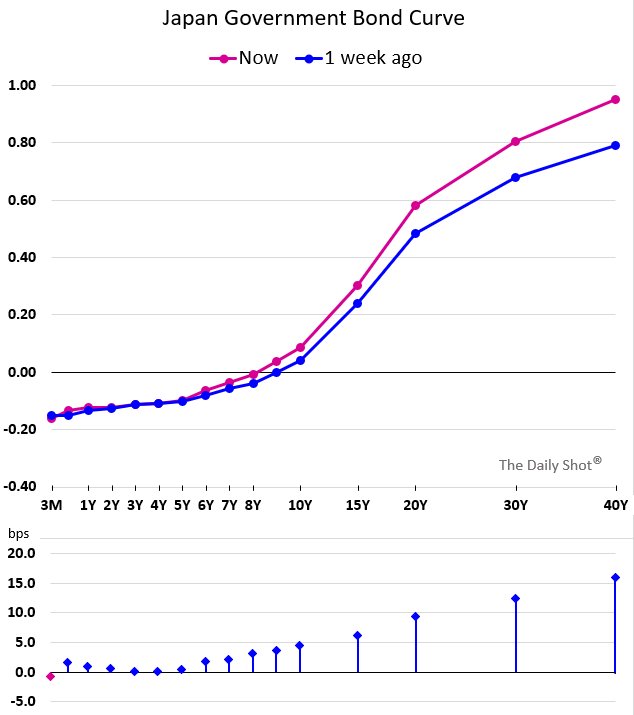
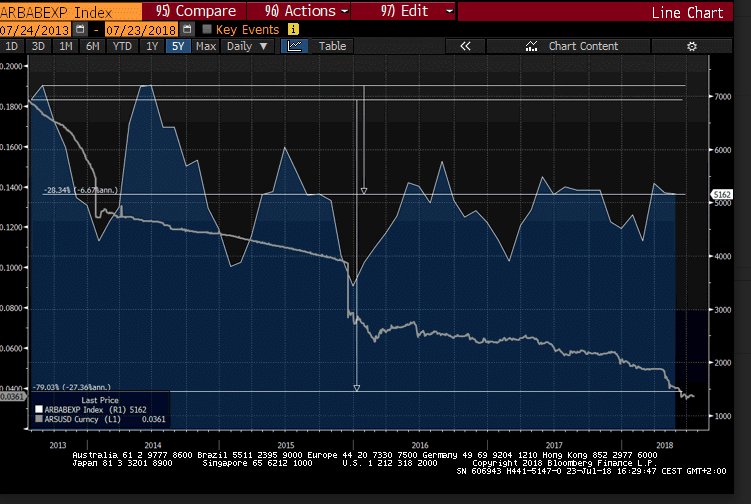
In pure economics the interest rate differential takes into account the inflation differential which should be reflected in exchange rate . So if india inflation is 7% and Japan at Zero then theoretically, INR should depreciate by 7% against JPY.

This is exactly what has happened .On Wednesday (July 25), the going rate for 1 Japanese yen was 61 paise, as per forex market data.In less than a year, the project’s loan burden has jumped by Rs 6,160 crore, or 7% of the loan amount, due to depreciation of the Indian rupee against the Japanese yen.

I have seen during last twenty years of my career, lot of corporates treasuries going for the lure of borrowing money in JPY or swapping their Indian rupee loan into JPY (at the advice of their BANKS) and ending up paying more than what they would have paid had the loan been in INR.

Leave it to Japanese to make Bullet train but be aware it will be an additional burden on India’s finances.


Charts That Matter- Vol 13

1. Burton Malkiel did perhaps more than anyone to popularize the notion that investing expertise is overrated in his classic book “A Random Walk Down Wall Street.” Despite some overwhelming evidence before and after the book’s publication and the rise of passive index funds, the Sohn Conference (where market experts give their best investment idea) is closely followed and attended by thousands of paying investment professionals.In an experiment done by WSJ,the returns by Dart pickers (just random people) beat the returns of some of the smartest investors.

The returns of dart pickers is in blue and investment experts in red

2. See these states colored in RED, well it is such a relief  to say that India has got normal monsoon but these states which will return more than 1/3 of lok sabha members next year are facing serious monsoon deficit….. . I am pretty sure there is one more financial relief package in offing.

3. Congratulation, now you can finally receive 1% for loaning 30 year money to Japan. What a deal!!!!!

4.The global digital health market has been valued at 118 billion dollars worldwide, according to industry research firm Statista. It is expected to reach a size of 206 billion by 2020, driven in particular by the mobile and wireless healthtech market. Managing patient data, telehealth applications as well as fitness and wellness, and consultation or remote control solutions via smartphones and interconnected healthcare devices are all driving growth in this area. Thanks to the robust outlook for this sector, healthtech trends may prove interesting when it comes long-term investment strategies.

Charts That Matter- Vol 12

1.Public sector projects under implementation are just money Guzzler and they are mostly not viable and never answerable to anybody because GOVT owns them on behalf of you and me . This will only increase the public debt which the govt will repay by either increasing taxes or through inflation.

2.Home Prices in dream city down 5% and if you have cash to pay then probably it is down 15%.I strongly believe Indians are making big mistake of buying houses when rental yields are closer to 2% ,10 year bond around 8% and inflation around 5%.Throw in rising Property and municipal taxes,renting is big winner by margin.

3.WASH RINSE REPEAT
Beijing made it clear that it will work to boost growth in response to the rising risks to the economy. They must be in a bad condition thats why they blinked, monetary tightening is now off the table. The stock market moved higher in response and commodities will follow like clockwork.

4.If you want a weaker dollar, best avoid having one of the strongest global economies, encouraging Capital inflows. You can’t have your cake and eat it too but Trump does not know that right?

5.That was the single most value destroying earnings con call in history.Facebook shares simply collapsed in after hours trading after the company missed revenue and growth forecasts. The loss in market cap was USD 140 billion, more than the market cap of any listed Indian company.

Equities still best place to invest

Armstrong economics explains it beautifully

“The interesting fact is that the majority of fund managers today have reduced their equity allocation to their lowest level since November 2016 according to Reuters. The reason for this is their focus of trade and their assumption that the Great Depression was caused by a PROTECTIONISM. According to yet a recent monthly report by Bank of America Merrill Lynch (BAML) where they conducted a survey of fund managers, the majority, some 60%, now fear a trade war. Clearly, the biggest concern out there is a trade war poses the greatest risk to the stock market. Another 19% fear excessively higher interest rates by the Federal Reserve. These two perceptions are the dominant reason we see consolidation.”

Michael Harnett at BOFA writes “Investor sentiment is bearish this month, with survey respondents eyeing the risks from a possible trade war,”  Within Equity Allocation Emerging market equity allocations were among the biggest casualties of the growing trade war fears. These suffered their biggest monthly drop in two years, taking the allocation down 23 percentage points to a net 1 percent underweight. (and you expect equities to fall?) yeah right

BAML further said this was the most crowded trade outright since “long U.S. dollar” in 2015. The allocation to tech stocks rebounded 10 percentage points to a net 33 percent overweight in July, making it the most favored sector of the month. (so everybody is long dollar hmmm )

Conclusion
I know they dont ring the bell at the top but “The sharp decline in asset allocation to equities has not been met with a collapse in market prices. so clearly market knows something and is not worried,this is a very interesting development for the majority NEVER manages to sell the high”.

Charts That Matter- Vol 11

1 Oh No this chart is not about Telecom Battle.In my view what is standing between social unrest and educated/unemployed youth in India is FREE data as it keep their minds occupied.

Enjoy… it will not last forever

2.5. Google trends show Mutual fund search at 18 months low and the result is stoppage of SIP’s

SIP are the support structure of indian equity markets and with most portfolio managers not beating their benchmarks , investors are getting disillusioned and stopping SIP’s
For April to June,2018; 30 lac fresh sip registrations and 12 lac have ceased. That’s 37%.
More alarming is in Direct option,5 lac fresh sips registered, 2.35 lac sip ceased. That’s almost 50%!!


3.Big moves are happening more often in markets. (Three-sigma being a move you’d expect to happen roughly one trading day every three years). If you are a trader reduce the size of position and if you are institution then better give more credence to your Risk Manager.

4.Devaluation is not a tool for exports, it is a tool for cronyism.
If a weaker currency really helped exports,Argentina would be the exporting champion of the world
Exports -6% pa Devaluation -27% pa

5.Inflation at 1 million percent.Congratulations Maduro….. you have achieved something of a feat putting your country  in a similar position as German Hyperinflation almost a century ago


Invest in short and sell Long

The global crisis is building in debt rapidly. After BOJ even the ECB came out and said it would stop its bond-buying program. Putin is selling off US debt very rapidly because of interest rates. The spin is always  political, but the trend toward higher rates is the real driving force. China also a large holder of US treasury will have to start selling US treasuries as they go into current account deficit.

Rising US rates will also act  as anchor to Global bonds.

In an upward cycle for interest rates, never lock & load – always stay nimble if you are the investor.The one thing you do not want to do is buy a long maturity paper . As rates go higher, you will be locked in and unable to take advantage of the rising rates. The safest thing would be to put money in overnight fund or commercial paper no more out than 90 days and keep the cash rolling in that area until we reach a point when the rates are peaking. Toward the end of cycle, is when you should look to add extremely long bonds.

On a risk adjusted basis liquid funds ( which invest in less than 90 days) have delivered the best returns over last 3 years

IF you want to play curve steepening then there is hardly any instrument in Indian Markets.More seasoned investors who want to play US strength and possible US curve steepening can do through

TBF -ETF

(The ProShares Short 20+ Year Treasury ETF provides daily inverse exposure to an index that tracks the performance of US Treasury securities with remaining maturities greater than 20 years.)

More on TBF

http://etfdb.com/etf/TBF/


Most Interesting Global ETF launches This year

Halfway through the year 124 new ETF have launched and there’s no question, the flow of new exchange-traded products coming to market remains robust.According to ETF.com there’s also some truly interesting ETFs that offer investors unique exposure and three of them caught their eye.

1.Amplify Transformational Data Sharing ETF (BLOK) expenses 0.7%

The Amplify Transformational Data Sharing ETF (BLOK) is a blockchain ETF. The SEC may not allow issuers to use that term in a product’s name, but that’s what BLOK and five other similar funds that launched this year really are.Blockchain ETFs are a way for investors to potentially capture the upside in cryptocurrencies indirectly. They could even prove to be superior to investing in cryptocurrencies directly.

2.Rogers AI Global Macro ETF (BIKR)…… associated with Jim Rogers expenses 1.18%

In the ETF world, there’s only one buzzword that’s arguably hotter than blockchain:artificial intelligence. Though the first ETFs to use A.I. came about in 2016 and 2017, this year has seen an explosion of funds using artificial intelligence.Distinct from ETFs that hold stocks of AI-related companies, these funds use AI models and algorithms to pick which stocks to hold. One such fund is the Rogers AIGlobal Macro ETF (BIKR), which launched amid much fanfare in June.

BIKR is not necessarily any better than other AI-powered ETFs, but it has the benefit of being associated with famed investor Jim Rogers.

3.Vanguard U.S. Liquidity Factor ETF (VFLQ) Expenses 0.13%

It currently is the only fund to specifically target stocks with low levels of liquidity.

In Vanguard’s view, less liquid stocks tend to outperform more liquid stocks over the long term. It’s the same factor that big investors such as endowments and foundations try to get by buying real estate and private equity, according to the firm.

There are six ETF in this category


Charts That Matter- Vol 10

1.Ultimate in Indian consumerism.Get your “DREAM MARRIAGE” financed by an NBFC.

2.This is the clearest example of a bubble. Think about this… The Bank of Japan makes a tiny, minuscule, ridiculous alteration to its monetary laughing gas policy,and sends bonds and markets rolling

3.what De-industrialization? The USA is still a global manufacturing powerhouse, and produced as much factory output in 2016 as Germany + S. Korea + India + Italy + France + UK COMBINED!

4. India is just too behind in this matrix. Neither we are spending on research nor we are adding researchers.

5. There is global race to secure Rare earths as they are used in all high tech applications and electronics.This is one place where chinese hold ace and Americans knows it.

6.Barclays has boosted its quaterly US GDP estimate,to be announced this week to 5.3%,highest since 2003.I think it has to do with inventory hoarding,done before tariff were implemented.This is basically preponing future GDP

Interesting Day for Global Markets

Japan was a bag of nerves today following the sell-off seen in JGB’s as 10yr rates moved from 3.5bp to 9.5bp. Only 6 BP move but ask Bond traders ….This is a HUGE MOVE  , JGB are known as widow makers.

This is the clearest example of a bubble. Think about this… The Bank of Japan makes a tiny, minuscule, ridiculous alteration to its monetary laughing gas policy,and sends bonds and markets rolling

The BOJ were forced to address the issue after talk that they were engaging in “unusual active discussions” according to an earlier Reuters quote. 10yr bonds closed around 8bp whilst Super-long 30yr closed 0.785%.

Martin Armstrong writes in his blog that…This is typical of the market not knowing how to interpret a move of higher rates from an unreal absolute level. Shanghai is moving on the Yuan move opening negative then spent the day trading higher to close up 1% by the close. More Yuan weakness is expected. SENSEX continues to benefit from the weakening INR ( yes slowly depreciating currency is like a fiscal stimulus) and  even managed a all-time peak intraday, this has more legs yet.
European stock indices were lower during the morning session, but that is probably a result of USD strength in the afternoon.

The cash flow continues to find its way to the US and that only looks to be accelerating. European bonds are starting to weigh on markets, even though volumes are light. US markets were traded within an extremely tight range given recent activity. After hours the Alphabet release was better than expected and shares jumped another 4%.

Banks shares are rallying as global bond market yields rise and curve steepening ( good for banks profitability).

On Friday we see the US GDP release and a possible 5%+ ( as per Barclays) highest since 2003 and that could really set things going! Momentum remains strong supported by earnings, a healthy GDP number will light the fuse.

So who is bearish on equities and bullish on Bonds?

More on Macro Call on Global markets please read this 9th July post.

http://worldoutofwhack.com/2018/07/09/market-view-is-the-coast-clear/


Charts That Matter- Volume 9

1.An Indian town is giving the likes of London, Tokyo, and San Francisco a run for their money when it comes to home-price appreciation.In the last one year, Surat,saw the highest rise in home prices among 150 cities tracked across the world by Knight Frank. Ahmedabad is also feautured in this list. In my view it is combination of base effect and succesfull remonetisation of system.

2. Longest expansion of returns on record worldwide ,thats why Balanced fund ( 60 equity 40 debt) are in vogue. This is also the reason that Investors think these Funds are better subsitute to their Fixed Deposits.Goldman writes that it is a matter of time we will see 10% correction.what will happen to these first time Balanced Fund investors then?

3.The most ironic thing about Trump questioning rate hikes is the fact that raising them is what is going to allow the market to go higher. The minute they pause or cut, capital flows will turn the other way, and asset prices will follow.

4.This chart shows China’s largest companies – now and a decade ago.The new behemoths are Technology companies and the market cap of top three chinese companies equals half of India’s GDP.

5.150-day worldwide Google trends data for ‘buy bitcoin’. Hmm this is interesting