Five Indicators that Suggest the Selloff in EMs Has Gone Too Far

Emerging market stocks have taken it on the chin so far in 2018, down 9% and underperforming the MSCI World Index by about 8%. There are of course plenty of excuses for such bad performance, from trade related issues to the breakdown of the synchronized global growth story. Even still, plenty of market-based indicators suggest the damage done to EM stocks has been a bit overdone.


Market view……is the Coast clear?

Global investing….Thought process for investing over next couple of  months

The CSFB Risk appetite has completely collapsed.

The first scare of trade war behind us ………more will be coming but later .

US Market action on Friday was positive with huge positive breadth, the day trade war was actually implemented

…. Sell the rumor ….Buy the fact

Dollar Index has successfully tested 95 zone but not breached it…..it will breach ,but not yet. Any fall in dollar index towards 91-92 will give breather to equity markets.

US and European bond yields have also retraced from high leading to easy monetary condition.

Emerging Markets could be bottoming near term http://blog.knowledgeleaderscapital.com/?p=14473. US markets including US small Cap (Russell 2000) and Nasdaq may see a new high as capital continues to move back top to US. (Small cap and Tech stocks relatively unhurt by trade war hence taking the market lead)
Inflation is building….
Velocity of money rising in US leading to easier monetary condition .Good sign of growth and Dollar funding


Japanese nominal wage growth at 24 years high

Orders for heavy trucks that haul trailers loaded with anything from junk food to oil-field equipment across the US skyrocketed 141% in June compared to a year ago, to 41,800 orders, making it the highest June ever recorded, according to transportation data provider FTR.
https://wolfstreet.com/2018/07/06/class-8-heavy-truck-orders-2018/.

Initial stages of inflation is good for equities.

The only concern I have is FED continuing Quantitative tightening….but there is no taper for couple of weeks

when I combine  various indicators,sentiment, market positioning and fear index, it looks like  world equity markets and precious metals are putting a trade able bottom. As long dollar trade unwinds Emerging equities and Emerging market bonds will get a breather and probably both will rally together.

The above is just a tactical view. My medium to long term view ( 1-5 years) on assets outside US is universally negative. I believe capital is headed back to US ( more on this later)and it will lead to significant selloff in global equities and global bonds. This capital reallocation will be positive for US Dollar and I expect dollar index to rally by 110-120 from current levels of 95 .

Hence any coming weakness in dollar is an opportunity for investors to reduce risk , illiquid assets and move back to safety of Cash.

History of Market Bubbles and crashes

Tulip Mania of 1637
• The Tulip mania was one of the first recorded speculative bubbles in history,

• It all started in the late 1500s when a local botanist named Carolus Clusius started to notice that some of the petal colors of the tulip flower began to change colors and this created unique patterns that were quite interesting in shape.

• As word got out, more and more people were intrigued and eventually Tulip brokerages were formed in an effort to facilitate trade for investors.

• The prices for these tulips started to rise to extraordinary levels by the mid 1620’s. In fact, some investors where trading their real estate holdings in exchange for certain highly sought after Tulip bulbs such as the Semper Ausustus.

• Later that year, as some individuals and investors began to take profit and sell their tulip holdings, prices started to fall. As prices fell, more people began to sell their stock of tulips. In addition to those who sold for profit, late investors started to get nervous and they too fearing a decline in price of tulips fueled the collapse.

South Sea Bubble of 1720
• The South Sea Bubble involved an international British trading firm that was given exclusive authority to trade with the Spanish colonies in the West Indies and South America as part of an agreement with the British government after the War of the Spanish Succession.

• The South Sea company was able to sell shares to the public and in addition to the highly lucrative trading profits, investors would also earn a 6% return on their capital which was to be paid directly by the British government.

• During this time, the stock price for the South Sea company was souring. In fact, by the summer of 1720, the share price of the company peaked to over £1000. But the company’s profits were nowhere in line with the public image it had created for itself.

• And so eventually as the promises made were not coming to fruition, selling ensured and prices began to drop. Within a span of a few months, the share price for the South Sea company fell by over 85%.

The Stock Market Crash of 1929
• The Stock Market Crash of 1929 was the worst stock market decline in percentage terms wiping away almost 90% of the value of the Dow Jones Index within four years.

• Prior to the share market crash of 1929, the economy was in full swing and booming. And with the advent of a concept called “margin”, many people who had never before invested in the stock market became active participants.

• Brokerage firms were now financing investment in the stock market with just 15 % or 20% down. Even banks joined in, and used depositors’ funds to buy stocks on margin. All of this frenzy led to share price overvaluations, as more and more investors jumped into the market.

• As soon as the stock market plunged it wiped out most if not all of the equity of leveraged investors and forced many to liquidate other assets to meet their obligations. In addition, many banks were bankrupt overnight, as they gambled their depositors’ funds in the market, and many only had 5% or 10% left to pay depositors’ claims

• It would not be until 25 years later, in 1954 that the Dow Jones would reach 383, the previous high prior to the Crash of 1929.

Black Monday – Stock Market Crash of 1987 • The infamous day Monday, October 19, 1987 is known as Black Monday. This is the day when equity markets around the world were shaken by a widespread selling frenzy.

• The Dow Jones plunged over 500 points, which account for a historic single day drop of 22%.

• And by the end of the month, most Stock Markets around the world were in disarray. The Australian market was down 41%, the Hong Kong market was down 45%, the United Kingdom market was down 26%, and the worst hit was the New Zealand market which had fell almost 60% from its recent high.

• Many professionals have put much of the blame on computerized programs that created large quantities of sell orders in the market, and triggering stop loss levels one after another, which eventually spiraled out of control.

Asian Financial Crisis of 1997
• The Asian financial crisis began with the collapse of the Thai baht, resulting from the Thai government’s inability to support its currency peg to the US Dollar. The Thai baht became a floating currency and devalued sharply as the country was on the verge of bankruptcy.

This crisis spread to other Southeast Asian nations as well including Indonesia, Philippines, Malaysia, and South Korea among others.

• The International Monetary Fund (IMF) was forced to deal with this ongoing crisis, and created a bailout package consisting of over $ 100 billion to help stabilize the region

Internet (Dot Com) Bubble of 2000
• During the mid 1990’s as the Internet was becoming mainstream, it created enormous opportunities for online companies. Both private and institutional money was pouring into online ventures like never before.

• Many internet startups were routinely being valued based on 75% or more growth over the coming 5 year period.

• By the end of first quarter of 2000, investors started to become wary of the exorbitant valuations, and things went downhill from there. Stocks began to fall, particularly in the technology sector, and the Dot Com dreams of many entrepreneurs came to an abrupt end.

• The majority of stocks and indices fell sharply until the market finally bottomed in 2002. During this period, the market wiped away over 5 trillion dollars in wealth, destroying the dreams and savings of many investors along the way.

Housing and Subprime Crisis of 2008
• The story begins back in the 1990’s when the US government started to create programs that would make buying a home more affordable, especially for those with less than perfect or troubled credit.

• As Main Street mortgage brokers were writing a historic number of new mortgages, Wall Street also got in on the action. They started to create and promote mortgage backed securities (MBS), which is a security comprised of a pool of mortgages.

• Wall Street introduced a new type of credit derivative called credit default swaps. Credit Default Swaps were similar to insurance policies. They were designed to protect against a company’s default. But a major flaw with CDS was that they were not regulated, and as such, premium writers were not required to segregate and allocate a reserve, as typical insurance companies are required to do.

• All of these factors lead to a highly over-leveraged environment that was susceptible to systemic risk.

• There was a period of 3 weeks between September and October 2008 wherein the Dow Jones Industrial Average sank more than 3500 points from its recent high. This was a huge stock market drop and accounted for more than a 30% decline in the value of the Dow.

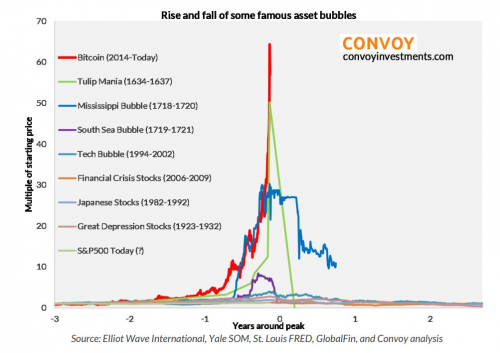
The Biggest Bubble of all time……Bitcoin Bubble

We witnessed the rise and fall of biggest bubble of all time as depicted by the almost vertical line in the chart at the top .

The concentration of money chasing an asset class and the resultant increase in supply of bubble asset determines the madness .

The supply constraint was responsible for this parabolic rise in Bitcoin .

The trigger for epic collapse was the regulatory overreach .

Bitcoin had threatened the monopoly of govt and its ability to print fiat money.


Chart book Q2-2018

“Chartbook” of the “most important charts” from the last quarter for you to review.
In addition to the graphs, RIA has provided a short excerpt from the article as well as the links to the original articles for further clarification and context if needed.

In most cases, the graphs, data, and commentary provided are different from that of the business media and Wall Street. Simply put, their analysis provides investors an edge that few are privy to.


India speeding up bankruptcy resolution

Hence there is lot of expectation from new bankruptcy code which sets a tight timetable for a defaulting company to deal with its debt: If it doesn’t come up with a solution in nine months, the company is liquidated. In May, Bhushan Steel Ltd, became the first of a group of large defaulters pushed into the bankruptcy court by the central bank to be resolved under the new rules. It was sold for $5.2 billion, and creditors recovered almost two-thirds of what they were owed.
“New investors have come in, taken out the old investors and the banks can get on with business.”
An insolvency industry—which has been waiting years for distressed assets to come on the market—is at last emerging in India, and the law has prompted more distressed debt funds to come to the country.

The teething trouble are already there and new code is  already facing legal challenges. Some cases are expected to drag well beyond the 270-day deadline as controlling shareholders and bidders contest points in court.

All the gains in stock Market can be attributed to 4% of listed stocks

There is a  4% rule as it pertains to retirement. It goes like this: If you begin retirement, withdrawing 4% of your savings and adjust each following year’s withdrawals for inflation, your money should last 30 years. It may be the most widely accepted and most often cited rule of personal finance.
There is another relatively new 4% rule.
In January of 2017, Hendrik Bessembinder, who is in the finance department of Arizona State’s business school, released an initial draft of a whitepaper he titled, “Do Stocks Outperform Treasury Bills?”
From 1926 to 2015 the average monthly return on a T-Bill was 0.38%, or roughly 4.56% annually. Surely stocks do better than  Treasury Bills, right? Turns out, most stocks fail to outperform T-Bills.
To reach this conclusion, Bessembinder looked at every single stock listed on all major exchanges .From 1926 through 2015. That’s over 26,000 stocks. He found that only 42.1% of them had returns that exceeded a T-Bill and that more than half had negative returns. The best 86 stocks, or roughly .33% of all stocks ever traded on one of the three major exchanges, accounted for half of all the gains in the stock market.
What’s more, all the gains generated by the stock market can be attributed to the best 1,000 stocks. That is, of the 26,000 stocks Bessembinder researched, just 4% account for every penny of wealth the stock market has ever created. The bottom 96%? Nothing. This is the other 4% rule.
As Bessembinder writes, “This study highlights that non-diversified stock investments are subject to the very real risk that they will fail to include the relatively few stocks that, ex post [based on actual results], generate very large cumulative returns.” Most education in the field of investing emphasizes diversification as a means of reducing risk. Bessembinder re-frames diversification as a means of capturing the full returns of the market. Fail to diversify and you could miss out on the small percentage of stocks that generate long-term wealth.

The implications of Bessembinder’s findings are many. It should make you think twice about how investing is depicted in the financial media. Most importantly, it should shift your focus from which stocks to pick to how you can capture the full returns of the market in as efficient a manner as possible.


Interest in Mutual fund declines to one year low

Google trends throws out some interesting trends. The web search for mutual funds is now at a year low.The interest was highest in the first week of this calender year and has been sliding since then.

Numbers represent search interest relative to the highest point on the chart for the given region and time. A value of 100 is the peak popularity for the term. A value of 50 means that the term is half as popular. A score of 0 means that there was not enough data for this term.The current value is 45 which is less than half of 100 seen in first week of january.

Visualizing The World’s 20 Largest Tech Giants

The most recent edition of Mary Meeker’s famous Internet Trends 2018 report highlighted the top internet companies in the world by valuation, with an interesting and perhaps unintended outcome.
Of the 20 largest tech giants globally, a total of zero are located outside of the United States and China.

Bond market signal and equity market hope

Inflation Targeting and farm loan waiver are two opposite objective but this will only lead to higher inflation and at some point of time stagflation as farm loan waiver does not create any asset with a cashflow by which the debt can be paid. Since bond market is more rational , it is already punishing state development loan ( SDL) yield and crowding out private investment. Equity market is still hoping for this govt spending and free money to be converted into earnings and to some extent it might happen but revenue spending can only take you so far. so what will be standing between an equity market rally and moderating overheating economy will be pace of central bank tightening.

https://www.livemint.com/Politics/NF80IIhIUrSxsKlfDftCcM/Farm-loan-waivers-to-touch-40-billion-by-2019-elections-Re.html