IL&FS: India’s Giant and Insolvent Shadow Bank Needs a Giant Bailout


Hemendra Hazari writes….

In a scathing attack on market participants “Intangible assets which need to be written off from shareholder funds are the culprit, and the significant rise in such assets, which in all likelihood are the losses incurred in the company’s subsidiaries, clearly reveals the problem. How the significance of such a basic disclosure, which is not even hidden in the notes to accounts, can have escaped the board of directors, the auditors, the credit rating agencies, the subscribers of IL&FS debt paper and the regulator paints a pathetic picture of the Indian financial system. Apparently, in all these years, nobody bothered to read the consolidated accounts of IL&FS, which are on the company’s website and hence in the public domain.”

But guys don’t worry Nobody is going to trial, forget jail …..as bureaucrats who sits on co board and who have been recipient of largesse knows  ” Baat Niklegi to dur talak jayegi” but you as a common person will pay for this bailout.

https://thewire.in/banking/ilfs-india-shadow-banking-bailout

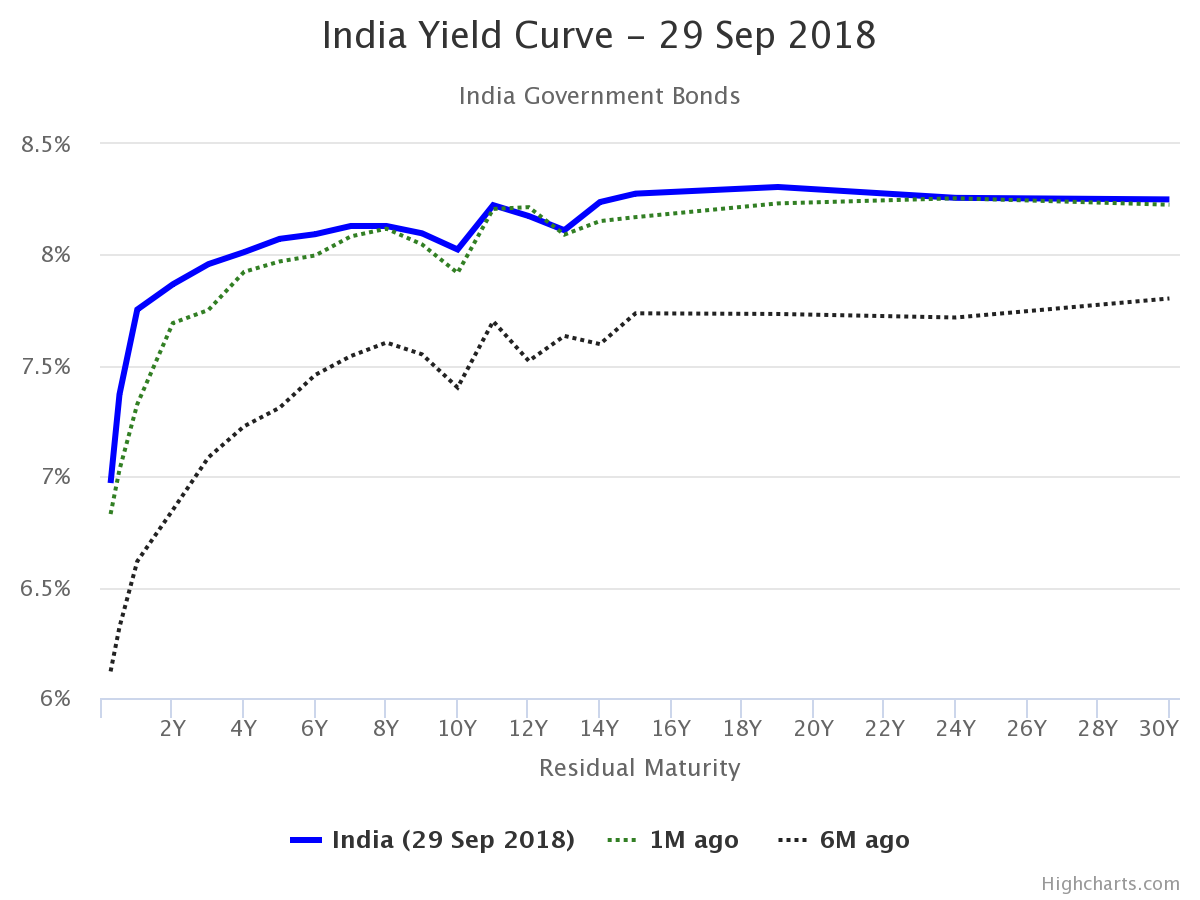
Flat Inverted or steep…. pick your own yield curve

Yield curve is actually a function of expectations. US is having the flattest yield curve,whereas china, Germany and Japan continues to see steepness in the curve.
The only difference between monetary policy of these four countries is ….. US FED is the only one hiking rates along with shrinking balance sheet, whereas central bankers in other three are still continuing with balance sheet expansion. Investors wants a term premium for longer maturities for these three countries govt debt hence yield curve is steep


India’s govt bond curve has also flattened since RBI has started hiking the rates

Expectation of hiking rates along with real rates in positive territory is akin to containing inflation along with moderating GDP growth. US is hiking inspite of a shit load of debt burden and India will be hiking to maintain the value of currency,but in both cases it is also to make govt debt attractive to investors in face of rising deficit.

Till US and India continues to do rate hikes, long bond yields might not rise and yield curve may actually invert .

what is coming after the yield inversion will be explained once the curve inverts


5-Hour Rule: If you’re not spending 5 hours per week learning, you’re being irresponsible

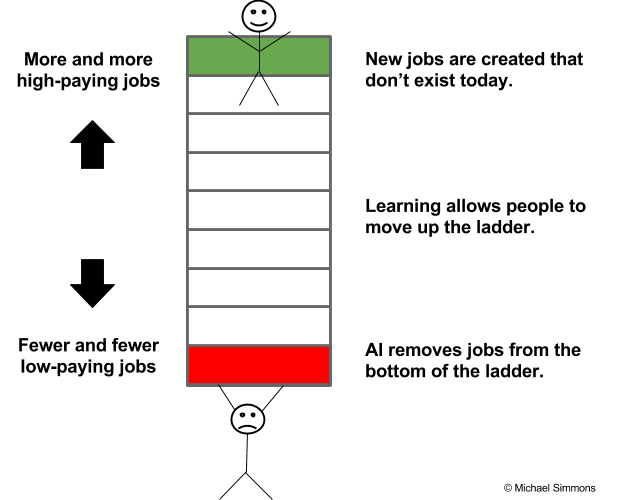
Michael writes..People at the bottom of the economic ladder are being squeezed more and compensated less, while those at the top have more opportunities and are paid more than ever before. The irony is that the problem isn’t a lack of jobs. Rather, it’s a lack of people with the right skills and knowledge to fill the jobs.

The art of impossible

Govt Borrowing cut by 70000 cr ……it should lead to lower interest rates right?? No not at all read on

even though 95% fiscal deficit is achieved in apr-aug period. As Satyakam writes … Todays H2 govt borrowing program looks like it has achieved the impossible. Finance minister made following statement on the same day the govt borrowing program was cut (how do you reconcile these two headlines)

Second ,disinvestment target is 80000 cr against current achievement of 9000 cr. Third, expenditure on account of MSP ( 10-15000 cr additional) , Ayushman Bharat  ( 10-15000 cr excess), govt subsidy for LPG and Kerosene ( 15-20000 cr) are additional expected outflows. Even then govt can see what we can’t see. Cutting buybacks of Govt security will only make matters worse in 2021-22 where current outstanding is heavy.

We are going back to old ways of pushing the liabilities into the future. Govt will resort to IOU, and this deficit will be funded by leveraging PSU balance sheet and delaying payment to nodal agencies. This will lead to artificial increase in short term credit demand exactly at the time when credit cycle has got stretched because of ILFS fiasco and NBFC funding mismatch.

The deposit creation in banking system is running at 8% YOY and credit demand is around 13%. This additional working capital demand will further widen the gap between deposits and credit, crowding out genuine borrowers.


India and the Emerging Markets

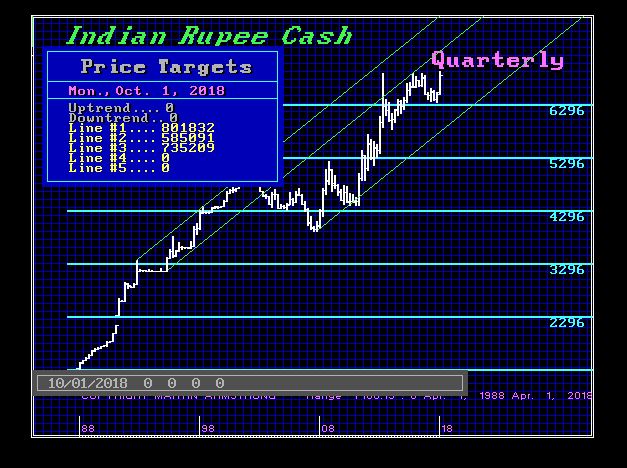
Martin armstrong writes in his blog….As interest rates rise and the dollar, the first casualty will be the Emerging Markets (EM). Because interest rates were driven to absurdly low levels in Europe and the USA, those who need yield ran off to the EM field. This drove capital rushing into the EM sector desperate for yield – especially state operated pension funds.This is why we have a serious debt crisis on our hands. The greenback is STILL going to press higher against the rupee. Just look at the pattern.

This is NOT an isolated high. We are looking at a significant rally still on the horizon for the dollar.

https://www.armstrongeconomics.com/international-news/india/india-the-emerging-market-crisis/

Why Gold Prices Could Go Higher Than You Think

Goehering & Rozencwajg writes in their Q2 commentary
We believe gold today is undervalued and that a huge gold bull market could lie in front of us.

As we wrote extensively first in the late 1990s and again today, we believe that gold has become radically undervalued. Although many investors believe that gold can’t be valued, we take a different view. We believe gold is like any other asset class. Asset classes (bonds, stocks, emerging markets, commodities or gold) become popular, sustain large price advances and become overvalued. At that point, they represent poor investments. Conversely, these same asset classes will often undergo long periods of investor disinterest, experience sustained and drawn-out price declines, and consequently will become undervalued. At that point, they often represent excellent investment opportunities.

We agree with consensus opinion regarding gold on a long-term basis: gold represents a poor investment. As its critics correctly point out, it pays no dividends or interest, and it is expensive to store. However, if investors can properly identify those periods when gold is severely undervalued, then gold (as an asset class), can produce superior (and indeed often spectacular) uncorrelated returns, just like it did back in 1929, 1970 and 1999.

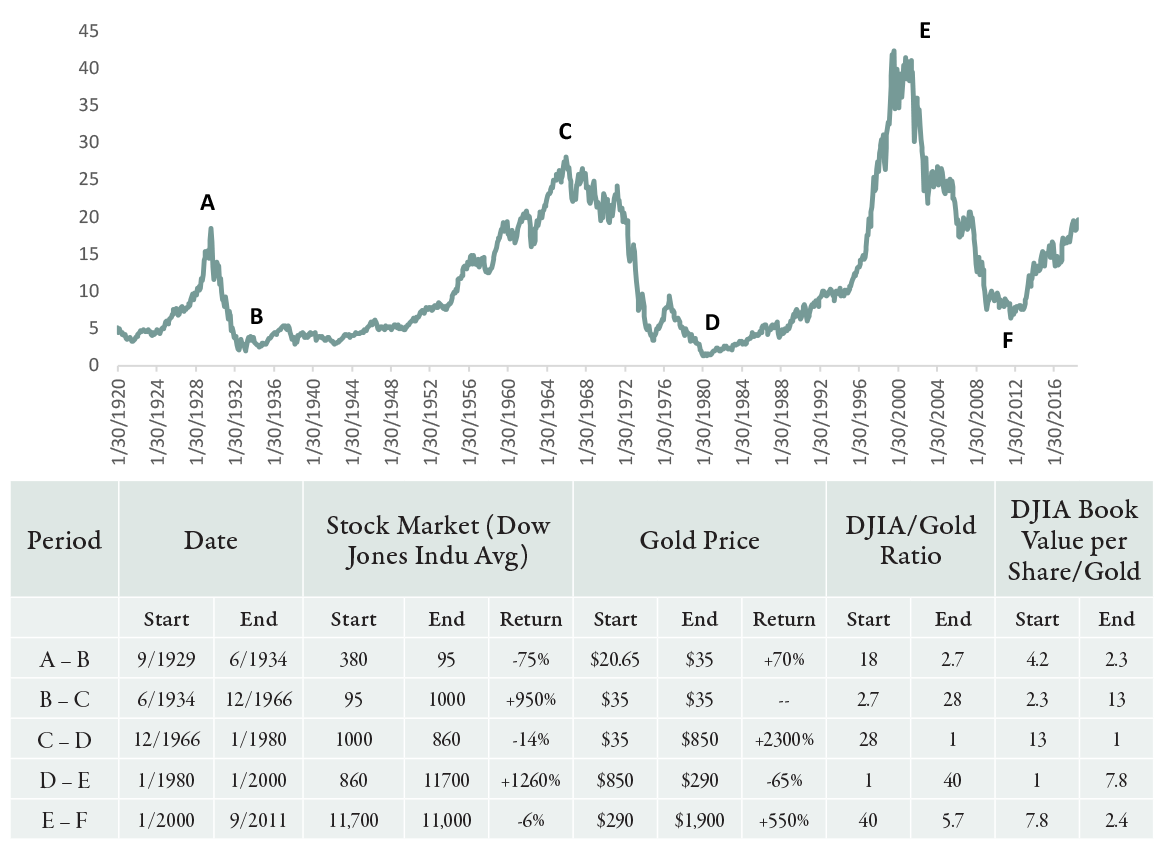
Let’s look at how gold has historically been priced relative to financial assets. The popularity of financial assets (especially the stock market) and gold tend to be inversely correlated and by measuring the divergence between stock prices and gold we can see where we stand in the investment cycle. One of our favorite ratios is the price level of the Dow Jones Industrial Average to gold’s price. As you can see from the chart below, there have been three distinct periods of extreme overvaluation of financial assets versus gold in the last 100 years: 1929, the late 1960s/early 1970s, and 1999/early 2000s.


Today, with the stock market having more than doubled since 2011 and gold prices today 35% below their 2011 peak, the Dow to gold ratio stands at 20. Although we have not reached the valuation extremes of 1970 or 1999, we are trading above the ratio of 18 achieved back in 1929, which was the first distinct period of extreme overvaluation during this 100-year span.
We believe the next leg in the great bull market could begin to take shape in the not too distant future. It has been over 38 years since we last saw speculative fevers grip global precious metal markets. We would not be surprised if the next upward move in gold ushers in a return of extreme speculative activity, something that has been completely absent from the gold bull market that started back in 2000. As the famed market commentator Richard Russell used to repeatedly tell investors: “There is no fever like gold fever.”

Beware the collapse in Non OPEC Oil Supply

Adam saw $ 100 on oil when oil was still in mid 50s…. he writes … We have reached a tipping point in this oil bull market. Since reaching the lows in the first quarter of 2016, oil prices have advanced almost three-fold, yet investors remain stubbornly bearish towards oil. Surging US shale production and an entrenched belief that global oil demand will peak and markedly decline as we progress into the next decade have caused investors to ignore the positive fundamentals in global oil markets over the last 18 months. Although oil-related investments have recently started to perform better, they continue to lag the oil price advance. Consensus opinion held that any OPEC deal to increase production would cause a near-collapse in prices as a new market-share war (with Russia now thrown in) would break out. Reflecting generally accepted consensus opinion, a Bloomberg headline shouted: “Coming Soon: ‘OPEC’s Worst Meeting Ever, Part 2.’ The Saudi about-face on production lays the ground for discord in Vienna.” But a funny thing happened after the June OPEC meeting concluded: even though a pact increasing oil production was agreed to, prices rallied with West Texas Intermediate (WTI) making a new high.

Oil prices have significantly exceeded consensus forecast over the last 12 months and, based upon our modelling for 2019, we believe the analytic community is again significantly underestimating oil prices. As we outlined in this letter’s introductory essay, https://cdn2.hubspot.net/hubfs/4043042/Commentaries/2018.Q2%20Commentary/2018.Q2%20Goehring%20&%20Rozencwajg%20Market%20Commentary.pdf investors do not understand the problems currently developing in conventional non-OPEC oil production which has already rolled over and is now declining.

In the next several years, our research tells us that declines in conventional non-OPEC oil production will accelerate significantly. Adam believe the bull market in oil, (ignored thus far every step of the way by the investment community) is set to dramatically accelerate to the upside.

His recommendation is…..Stay long oil and oil related investments.

The Amazonification of Healthcare

This “Amazonification effect” is transforming every industry from retail to finance – and the healthcare industry is now set to change forever for both consumers and businesses.
Dreams of Amazonification
Today’s infographic comes to us from Publicis Health, http://www.visualcapitalist.com/amazonification-healthcare/and it shows the shift occurring in the healthcare space to a new outcome-based economy that is powered by an increasingly digital and data-driven experience.
It’s also led by the millennial generation, a group that is seeing buying power finally line up with their influence. These digital natives see no reason for the healthcare experience to be stuck in its old ways – they demand a fast, digital, convenient, and quantified version of healthcare along with ongoing relationships.
The ideal healthcare experience for this group looks something like this:
Convenient access
59% of U.S. healthcare consumers want their digital healthcare experience to mirror retail.
Digital channels
74% of millennial patients value the ability to book appointments and pay bills online.
Ongoing relationship
48% of healthcare consumers want to partner with their healthcare providers for personalized treatment.
Treating patients more like retail consumers will be a paradigm shift for healthcare – and it will require companies to invest in areas like big data to complete the patient experience.

Why Do Debt Crises Come in Cycles? Ray Dalio

Why Do Debt Crises Come in Cycles?
I find that whenever I start talking about cycles, particularly big, long-term cycles, people’s eyebrows go up; the reactions I elicit are similar to those I’d expect if I were talking about astrology. For that reason, I want to emphasize that I am talking about nothing more than logically-driven series of events that recur in patterns. In a market-based economy, expansions and contractions in credit drive economic cycles, which occur for perfectly logical reasons. Though the patterns are similar, the sequences are neither pre-destined to repeat in exactly the same ways nor to take exactly the same amount of time.
To put these complicated matters into very simple terms, you create a cycle virtually anytime you borrow money.
Buying something you can’t afford means spending more than you make. You’re not just borrowing from your lender; you are borrowing from your future self. Essentially, you are creating a time in the future in which you will need to spend less than you make so you can pay it back. The pattern of borrowing, spending more than you make, and then having to spend less than you make very quickly resembles a cycle. This is as true for a national economy as it is for an individual. Borrowing money sets a mechanical, predictable series of events into motion.
If you understand the game of Monopoly®, you can pretty well understand how credit cycles work on the level of a whole economy. Early in the game, people have a lot of cash and only a few properties, so it pays to convert your cash into property. As the game progresses and players acquire more and more houses and hotels, more and more cash is needed to pay the rents that are charged when you land on a property that has a lot of them. Some players are forced to sell their property at discounted prices to raise that cash. So early in the game, “property is king” and later in the game, “cash is king.” Those who play the game best understand how to hold the right mix of property and cash as the game progresses.
Now, let’s imagine how this Monopoly® game would work if we allowed the bank to make loans and take deposits. Players would be able to borrow money to buy property, and, rather than holding their cash idly, they would deposit it at the bank to earn interest, which in turn would provide the bank with more money to lend. Let’s also imagine that players in this game could buy and sell properties from each other on credit (i.e., by promising to pay back the money with interest at a later date). If Monopoly® were played this way, it would provide an almost perfect model for the way our economy operates. The amount of debt-financed spending on hotels would quickly grow to multiples of the amount of money in existence. Down the road, the debtors who hold those hotels will become short on the cash they need to pay their rents and service their debt. The bank will also get into trouble as their depositors’ rising need for cash will cause them to withdraw it, even as more and more debtors are falling behind on their payments. If nothing is done to intervene, both banks and debtors will go broke and the economy will contract. Over time, as these cycles of expansion and contraction occur repeatedly, the conditions are created for a big, long-term debt crisis.
Lending naturally creates self-reinforcing upward movements that eventually reverse to create self-reinforcing downward movements that must reverse in turn. During the upswings, lending supports spending and investment, which in turn supports incomes and asset prices; increased incomes and asset prices support further borrowing and spending on goods and financial assets. The borrowing essentially lifts spending and incomes above the consistent productivity growth of the economy. Near the peak of the upward cycle, lending is based on the expectation that the above-trend growth will continue indefinitely. But, of course, that can’t happen; eventually income will fall below the cost of the loans.
Economies whose growth is significantly supported by debt-financed building of fixed investments, real estate, and infrastructure are particularly susceptible to large cyclical swings because the fast rates of building those long-lived assets are not sustainable. If you need better housing and you build it, the incremental need to build more housing naturally declines. As spending on housing slows down, so does housing’s impact on growth. Let’s say you have been spending $10 million a year to build an office building (hiring workers, buying steel and concrete, etc.). When the building is finished, the spending will fall to $0 per year, as will the demand for workers and construction materials. From that point forward, growth, income, and the ability to service debt will depend on other demand. This type of cycle—where a strong growth upswing driven by debt-financed real estate, fixed investment, and infrastructure spending is followed by a downswing driven by a debt-challenged slowdown in demand—is very typical of emerging economies because they have so much building to do.
Contributing further to the cyclicality of emerging countries’ economies are changes in their competitiveness due to relative changes in their incomes. Typically, they have very cheap labor and bad infrastructure, so they build infrastructure, have an export boom, and experience rising incomes. But the rate of growth due to exports naturally slows as their income levels rise and their wage competitiveness relative to other countries declines. There are many examples of these kinds of cycles (i.e., Japan’s experience over the last 70 years).
In “bubbles,” the unrealistic expectations and reckless lending results in a critical mass of bad loans. At one stage or another, this becomes apparent to bankers and central bankers and the bubble begins to deflate. One classic warning sign that a bubble is coming is when an increasing amount of money is being borrowed to make debt service payments, which of course compounds the borrowers’ indebtedness.
When money and credit growth are curtailed and/or higher lending standards are imposed, the rates of credit growth and spending slow and more debt service problems emerge. At this point, the top of the upward phase of the debt cycle is at hand. Realizing that credit growth is dangerously fast, the central banks tighten monetary policy to contain it, which often accelerates the decline (though it would have happened anyway, just a bit later). In either case, when the costs of debt service become greater than the amount that can be borrowed to finance spending, the upward cycle reverses. Not only does new lending slow down, but the pressure on debtors to make their payments is increased. The clearer it becomes that debtors are struggling, the less new lending there is. The slowdown in spending and investment that results slows down income growth even further, and asset prices decline.
When borrowers cannot meet their debt service obligations to lending institutions, those lending institutions cannot meet their obligations to their own creditors. Policy makers must handle this by dealing with the lending institutions first. The most extreme pressures are typically experienced by the lenders that are the most highly leveraged and that have the most concentrated exposures to failed borrowers. These lenders pose the biggest risks of creating knock-on effects for credit worthy buyers and across the economy. Typically, they are banks, but as credit systems have grown more dynamic, a broader set of lenders has emerged, such as insurance companies, non-bank trusts, broker-dealers, and even special purpose vehicles.
The two main long-term problems that emerge from these kinds of debt cycles are:
1) The losses arising from the expected debt service payments not being made. When promised debt service payments can’t be made, that can lead to either smaller periodic payments and/or the writing down of the value of the debt (i.e., agreeing to accept less than was owed.) If you were expecting an annual debt service payment of 4 percent and it comes in at 2 percent or 0 percent, there is that shortfall for each year, whereas if the debt is marked down, that year’s loss would be much bigger (e.g., 50 percent).
2) The reduction of lending and the spending it was financing going forward. Even after a debt crisis is resolved, it is unlikely that the entities that borrowed too much can generate the same level of spending in the future that they had before the crisis. That has implications that must be considered.
Can Most Debt Crises Be Managed so There Aren’t Big Problems?
Sometimes these cycles are moderate, like bumps in the road, and sometimes they are extreme, ending in crashes. In this study we examine ones that are extreme—i.e., all those in the last 100 years that produced declines in real GDP of more than 3 percent. Based on my examinations of them and the ways the levers available to policy makers work, I believe that it is possible for policy makers to manage them well in almost every case that the debts are denominated in a country’s own currency. That is because the flexibility that policy makers have allows them to spread out the harmful consequences in such ways that big debt problems aren’t really big problems. Most of the really terrible economic problems that debt crises have caused occurred before policy makers took steps to spread them out. Even the biggest debt crises in history (e.g., the 1930s Great Depression) were gotten past once the right adjustments were made. From my examination of these cases, the biggest risks are not from the debts themselves but from a) the failure of policy makers to do the right things, due to a lack of knowledge and/or lack of authority, and b) the political consequences of making adjustments that hurt some people in the process of helping others. It is from a desire to help reduce these risks that I have written this study.
Having said that, I want to reiterate that 1) when debts are denominated in foreign currencies rather than one’s own currency, it is much harder for a country’s policy makers to do the sorts of things that spread out the debt problems, and 2) the fact that debt crises can be well-managed does not mean that they are not extremely costly to some people.
The key to handling debt crises well lies in policy makers’ knowing how to use their levers well and having the authority that they need to do so, knowing at what rate per year the burdens will have to be spread out, and who will benefit and who will suffer and in what degree, so that the political and other consequences are acceptable.

https://www.linkedin.com/pulse/why-do-debt-crises-come-cycles-ray-dalio/