Why Failed Predictions Don’t Matter

by Nick Maggiulli

The UFOs were supposed to arrive around 4PM on December 17, 1954.  At least that’s what the Seekers, a Chicago-based cult group, were told by their leader through a decoded message.  The core belief of the Seekers was that the end of the world was near and that “spacemen” were coming to rescue them from this impending doom.    

But, as 4PM came and went, the spacemen never arrived. 

“What went wrong?” some of the members asked themselves.  The group was forced to rationalize the no-show. 

Initially, some members of the group suggested that their saviors from space never arrived because a few non-committed members were at the event.  This theory was not accepted by the group, so they kept discussing.

Finally, one of the group leaders declared that this had been a “practice run” to test their skills.  It was all a drill, and they all had passed magnificently.  This explanation was wholeheartedly embraced by all but one member of the group.  

However, over the course of the next week, three more rapture predictions were followed by three more failures and three more equally impressive rationalizations.

One such prediction never materialized because it was “another drill.”  Another failed because, as the leadership determined, the group’s deep dedication actually prevented the apocalypse from happening altogether.  This ingenious excuse changed the Seekers from failed prophets to the saviors of humanity in one fell swoop.  

And with each failed prediction, most of the group members stay committed with some of them even increasing the conviction of their beliefs.  Here is how one member explained their commitment to the group in When Prophecy Fails:

I’ve had to go a long way.  I’ve given up just about everything.  I’ve cut every tie.  I’ve burned every bridge.  I’ve turned my back on the world.  I can’t afford to doubt.  I have to believe.

The most amazing part of this story is that out of the 11 members of the Seekers, only two left the group following the string of incorrect predictions.  As the authors of When Prophecy Fails note:

It is reasonable to believe that dissonances created by unequivocal disconfirmations cannot be appreciably reduced unless one is in the constant presence of supporting members who can provide for one another the kind of social reality that will make the rationalization of disconfirmation acceptable.  

In other words, if you have a social support system, any such conflicting beliefs can be overcome with rationalizations.  This is evidenced by the fact that the two members who left the Seekers were the ones most isolated from the group.  

This brings me to my main point. 

It’s been a week since the long-awaited Bitcoin halving, and it appears that the massive price increase that was supposed to occur, never materialized.  Everyone who claimed that, “the Bitcoin halving isn’t priced in,” and that a drop in supply would lead to a big increase in price was clearly in the wrong.

However, I know that this unfortunate fact won’t matter to the diehard HODLers of Bitcoin anyway.  After all, it didn’t matter when these BTC price predictions failed to come to fruition:
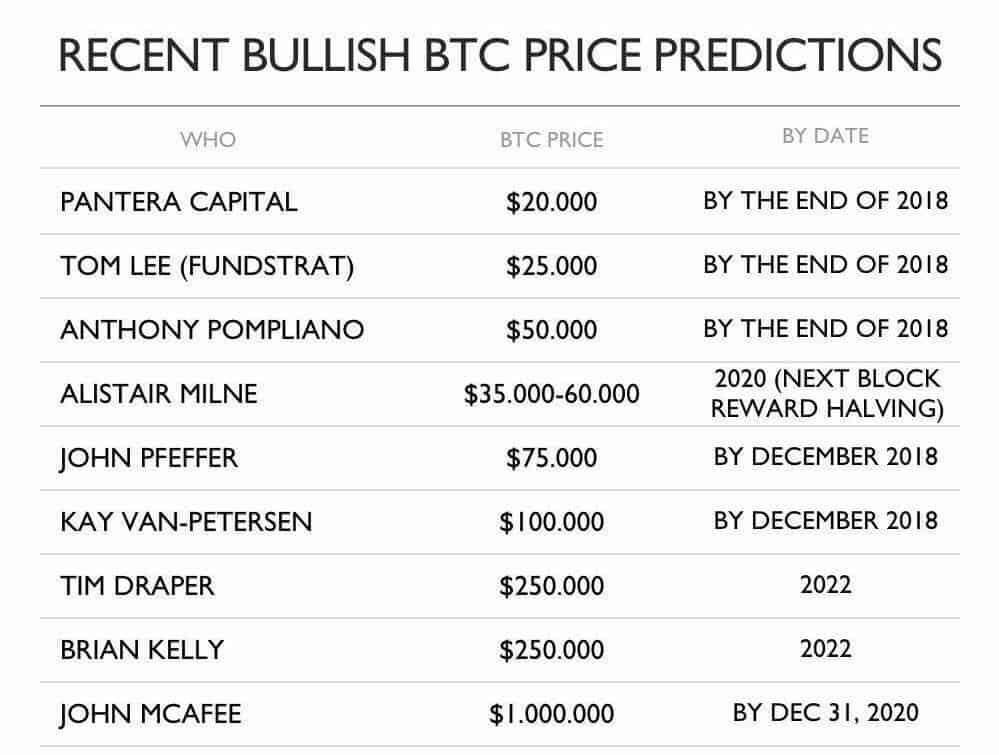
And won’t matter when future ones fail either. 

It’s like this Jurassic Park meme on repeat:

In all seriousness, I used to think that making a prediction that turned out embarrassingly wrong was bad for your image, but I’ve slowly begun to realize that most people, especially devout followers, don’t really care. 

Why?  Because it is so easy to rationalize the failed predictions after the fact without causing any long-term reputational damage.  

For example, do you think that fans of Elon Musk cared when he got this COVID-19 prediction so gloriously wrong?
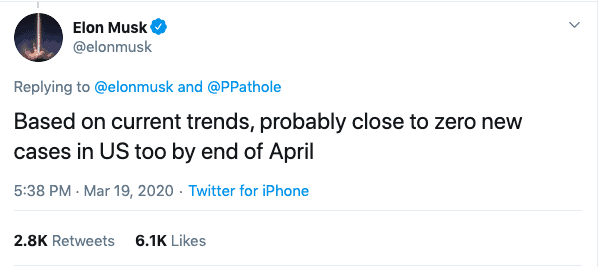
Nope.   

How do I know?  Because look at the level of engagement on this tweet response illustrating Elon’s massive error:
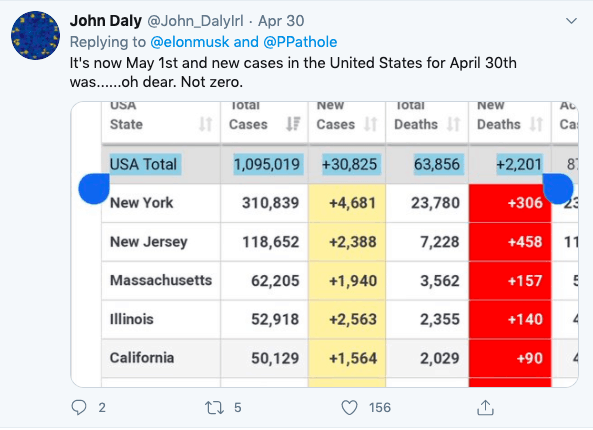
5 Retweets.  156 likes.     

In Elon’s world that basically rounds to zero.  The tweet might as well not exist.

And when I’ve Tweeted similarly snarky replies towards individuals with equally wrong predictions, do you think this caused a mass exodus among their followers?  Not a chance.  

Just like the Seekers who remained committed in the midst of conflicting evidence, most people can overcome cognitive dissonance with the right amount of social support.  

You can say the same thing about Bitcoiners, permabulls (like myself), and, dare I say, value investors.  

After all, the prophets of AQR have come down from the mountain top yet again to tell us why now is a fantastic time to invest in value stocks.  This is only 7 months after they nudged us to “sin a little” in value’s direction.  So, does that imply that today I should be sinning a lot?  Should I become the Lucifer of value investing?

Despite my sardonic tone, I am not implying that value investors or Bitcoiners are apart of a cult, only that the same mental processes are at work within these groups as well.  Reducing cognitive dissonance is a hell of a drug.    

This explains why most followers won’t abandon the faith when their leaders get things wrong.  Because failed predictions never really mattered.  Just think of how many famous politicians and business leaders have made terrible predictions, yet are still revered.  

For example, Steve Jobs said that the Segway would be “bigger than the PC”, Steve Ballmer laughed at the unveiling of the iPhone, and Alan Greenspan called for double digit interest rates after 2007.  All of them were dead wrong, but, who cares?

In honor of this recent revelation, here are some predictions I have for the next decade:

  • The Dow will reach 60,000 before 2030.
  • Interest rates in the U.S. will go negative and will stay low for the foreseeable future.
  • Inflation in U.S. dollars will remain low for the foreseeable future.
  • Large gatherings (i.e. concerts, cruises, packed bars, etc.) will return even if we don’t find a COVID-19 vaccine.  
  • Working remotely will not replace most in-person offices.
  • There will be major overhauls in the tax system to reduce wealth inequality.

You may not agree with my predictions, but that’s okay.  Because if I’m wrong, I know you won’t really care, will you?


Nobody Cares About Your Failures

Despite my cynicism throughout this post, there is a silver lining in all this.  That silver lining is that people don’t care about your failed predictions because they don’t really care about your failures. 

This really hit home for me after reading a post from fellow blogger Four Pillar Freedom where he discussed what he has learned since he turned 18:

The world isn’t watching you as closely as you think. Take more chances. Your failures will mostly go unnoticed. And those who do notice rarely care.

And it’s so true.  We tend to forget that most people are so worried about their own problems that they don’t have time to think about your own faults.  This is why, earlier this year, I wrote:

When people don’t like your work, the response isn’t negativity, but silence.

But that silence is soon forgotten.  Let me prove it. 

How often do you think about my “less than stellar” blog posts? 

I already know your answer—never!  Because, why would you? 

You will forget one of my mediocre blog posts much more quickly than I ever could.  Well, guess what? 

The same thing is true for any of your failures as well.  They will mostly be forgotten by most people.  But if you are still skeptical, consider what one of the greatest athletes of all time had to say about failure:

I missed more than 9,000 shots in my career.  I’ve lost almost 300 games.  26 times I’ve been trusted to take the game winning shot, and missed.  I’ve failed over and over and over again in my life.  And that is why…I succeed.

-Michael Jordan

 Thank you for reading!

Global Bubbles are DEFLATING-Doug Noland

“Bubble” is commonly understood to describe a divergence between overvalued market prices and underlying asset values. And while price anomalies are a typical consequence, they are generally not among the critical aspects of Bubbles. I’ll start with my basic definition: A Bubble is a self-reinforcing but inevitably unsustainable inflation.

Bubbles, at their core, are fueled by Credit – or “Credit inflation.” Asset inflation and speculative asset price Bubbles are a common upshot. At their core, Bubbles are mechanisms of wealth redistribution and destruction.

The more protracted the Bubble period, the greater the maladjustment to underlying financial and economic structures. And the longer the Bubble inflation, the greater the wealth disparities and underlying social and political strain. While Bubble-related inequalities reveal themselves more prominently later in the up-cycle, the scope of wealth destruction only becomes apparent as the Bubble finally succumbs. As Dr. Richebacher always stressed, there’s no cure for Bubbles other than not allowing them to inflate. The catastrophic policy failure over the past 20 years has been the determination to aggressively inflate out of post-Bubble stagnation.

Bubbles can have profound geopolitical impacts as well. The inflation of Bubbles and corresponding booming economies promote the view of an expanding global economic “pie”. The inflating Bubble phase is associated with cooperation, integration and solidarity. The backdrop shifts late in the Bubble phase, as inequities and maladjustment become more discernible. Bursting Bubbles mark a radical redrawing of the geopolitical landscape. The insecurities and animosities associated with a shrinking economic pie see a rise of nationalism and “strongman” leadership. The backdrop drifts toward fragmentation, disintegration and conflict.

Regular CBB readers are familiar with this analytical framework. It is being reiterated this week because of the value I believe it provides in understanding this most extraordinary of environments. To disregard that the world was late in a historic Bubble period prior to COVID leaves analysts disadvantaged. Whether in the markets, real economies, politics or geopolitics, Bubble Dynamics these days play a profound role. This is becoming clearer by the week.

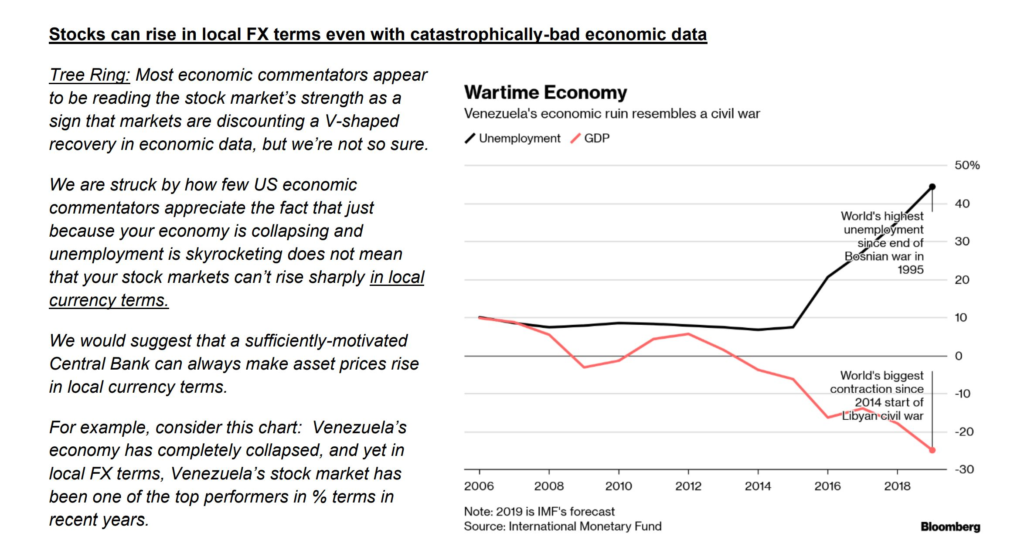
Let’s start with the markets. So, U.S. equities have diverged dramatically from underlying fundamentals. Most believe this is simply the marketplace peering over the valley to the reemergence of growth once the economy moves past the pandemic. More plausible analysis focuses on the securities price impact from unprecedented monetary inflation.

Federal Reserve Assets surged $213bn last week to a record $6.934 TN, pushing the 10-week gain to $2.693 TN. M2 “money supply” (with a week’s lag) expanded another $199bn, with a 10-week rise of $2.257 TN. Institutional Money Fund Assets (not included in M2) added $15bn, boosting its 10-week expansion to $961bn.

There is clearly ample monetary fuel to push equities higher in the short-term. Yet our analysis must also factor in the Market Structure that evolved over a most protracted Bubble period. In particular, powerful speculative Bubble Dynamics fundamentally altered market perceptions and mechanisms. Assorted trend-following strategies supplanted traditional investment analysis. Algorithmic trading changed market behavior. The massive ETF complex fostered trend-following and performance chasing strategies. Negative fundamentals notwithstanding, “FOMO” (Fear of Missing Out) plays a profound role in today’s highly speculative market backdrop. To be sure, sustaining a vigorous speculative market dynamic was one cost of the Fed’s hasty and massive market bailout.

Derivatives are also playing a momentous role in market dynamics. During the boom, faith in central bank backstops promoted risk-taking. Why not revel in risk so long as derivative market “insurance” is so cheap and readily available? This whole notion of hedging market risk is a dangerous case of “fallacy of composition.” Individual market participants can hedge market risk, offloading exposure to a counter-party in the event of a significant market decline. However, it is not possible for much of the market to offload risk. There will be no one within the marketplace with the wherewithal to absorb such losses in a crisis environment.

Much of the market protection these days is offered by sellers using dynamically-traded (“delta”) hedging strategies. If an institution purchases put options that strike below current market levels, the sellers of those puts will short futures or ETFs to hedge their rising exposures in the event of a declining market. As was witnessed in March, a market fall can quickly spiral into illiquidity and self-reinforcing dislocation – as writers of market protection flood the marketplace with sell orders (to hedge put option exposures that rise parabolically as strike prices are reached and these options trade “in the money”).

This problem was identified with the popularity of “portfolio insurance” strategies leading up to the 1987 stock market crash. But the benefits of cheap market “insurance” (i.e. risk-taking, loosened financial conditions, higher asset prices, wealth effects and associated economic stimulus) ensured policymakers were willing to ignore this risk. As I’ve highlighted over the years, much of the massive derivatives complex operates on the assumption of liquid and continuous markets, a specious premise made credible only with central bank liquidity backstops. Keeping this backstop viable during a period of expanding Bubbles has required increasingly egregious policy measures and market interventions.

I’ll posit that we’re witnessing the overarching risk associated with this scheme coming to fruition. Derivative-related hedging strategies became a commanding aspect of late-cycle speculative market dynamics. Derivatives then played prominently as markets collapsed into illiquidity in March, only to see the Fed resort to unprecedented monetary inflation ($2.7 TN and counting).

Egregious “money printing” operations provoked a sharp market reversal. This spurred a major unwind of hedges and bearish bets instrumental in fueling a dramatic market recovery. And as the market rallied, targeting stocks with large short (and put option) positions became quite a rewarding speculative endeavor. A major short squeeze unfolded, powering the market higher. A surging market in the face of a faltering Bubble recalls the period August to October 2007. Watching the big tech stocks going into melt-up recalls the final derivative-induced Q1 2000 speculative blow-off (at the precipice of a major down-cycle).

After fomenting risk-taking during the Bubble period, the marketplace for market “insurance” has turned hopelessly dysfunctional. It now ensures bouts of “risk off” liquidation quickly risk escalating into illiquidity and dislocation. And during “risk on,” the unwind of hedges will stoke upside dislocation and speculative excess. Importantly, these dynamics negate traditional market adjustment and correction dynamics. The resulting extreme divergence between securities prices and economic prospects raises the odds of a market crash – along with Trillions more Federal Reserve stimulus.

The U.S. was a “Bubble Economy” – having suffered from years of structural maladjustment. There was ongoing proliferation of enterprises that would prove uneconomic in a post-Bubble backdrop of tighter financial conditions, negative wealth effects and altered spending and investing patterns. A meaningful segment of the economy was driven by boom-time discretionary spending, creating latent vulnerabilities. Moreover, such an economic structure (over-indebted, savings deficient and replete with negative cashflow entities) becomes a Credit glutton. We’re beginning to see how Trillions of federal fiscal spending will be absorbed like a huge dry sponge.

May 15 – Bloomberg (Erik Wasson and Billy House): “The House passed a $3 trillion Democratic economic stimulus bill Friday that Republicans and President Donald Trump have already rejected and isn’t likely to trigger bipartisan negotiations any time soon. The measure, passed 208-199, would give cash-strapped states and local governments more than $1 trillion while providing most Americans with a new round of $1,200 checks. House Speaker Nancy Pelosi said it should be the basis of talks with the GOP-controlled Senate and White House, which have called for a ‘pause’ to allow earlier coronavirus recovery spending to work.”

On the other side of the globe, China faces the consequences of historic Bubble Economy maladjustment. New Chinese credit data this week corroborates Bubble Analysis. Total Chinese Aggregate Financing jumped $435 billion for the month of April, a typically slow month for lending (compared to April 2019’s $240bn). This pushed system Credit growth to an alarming $2.0 TN for just the first four months of 2020, 38% ahead of comparable 2019 growth (then a record). Bank Loans rose $240 billion in April, with one-year growth of $2.669 TN, or 13.1%. Aggregate Financing surged $4.156 TN, or 12.0%, over a year of historic Credit growth.

China’s M2 “money supply” expanded another $177 billion during April. M2 expanded $2.09 TN, or 15.1% annualized, over the past six months. M2 gained $2.95 TN, or 11.1%, over the past year. Over two years, M2 ballooned $5.018 TN, or 20%.

If the scope of monetary inflation isn’t alarming enough, the parabolic rise in Chinese Credit comes in the throes of a major economic contraction. Enormous state-directed lending has supported the economy and markets, while holding Credit losses at bay. Beijing is gambling that stimulus will return China’s growth to its pre-COVID trajectory. But with China’s consumers remaining cautious and global depression becoming a major problem for the nation’s colossal export sector (and banking system), odds of disappointing growth are high.

May 10 – Bloomberg: “The People’s Bank of China said it’ll resort to ‘more powerful’ policies to counter unprecedented economic challenges from the coronavirus pandemic… The central bank will ‘work to offset the virus impact with more powerful policies,’ paying more attention to economic growth and jobs while it balances multiple policy targets… It reiterated that prudent monetary policy will be more flexible and appropriate and it’ll keep liquidity at a reasonable level. The remarks reflect the PBOC’s growing concern over the unprecedented economic downturn and the risk of a second quarter of contraction, given sluggish domestic demand and the collapsing global economy.”

Relative Chinese stability masks mounting risk. It is difficult to see how this doesn’t manifest into a crisis of confidence in Chinese finance. Systemic risk is in parabolic rise (rapid growth of Credit of deteriorating quality). I expect wary households to hold back on discretionary spending, while overcapacity will haunt the business sector for years to come. We can assume fraud is commonplace throughout China’s financial sector. I suspect enormous speculative leverage has accumulated over this protracted cycle, buoyed by China’s managed currency regime and the perception of PBOC and “national team” market liquidity backstops. I believe the vulnerable renminbi much remains a global crisis Fault Line.

May 13 – Financial Times (Tom Mitchell and Don Weinland): “Donald Trump’s order to stop the US government’s main pension fund from investing in Chinese equities will only hurt US investors, Beijing has warned as trade tensions between the countries threatened to turn into a ‘financial fight’. Beijing officials have been worried since late last year that Mr Trump would follow up his two-year China trade battle with action in financial markets. The latest shot in that conflict was fired… by the US president.”

This so-called “financial fight” was inevitable – and appears to have commenced in earnest. When do they invoke the threat of liquidating Treasury holdings? The unfolding U.S. vs. China cold war has entered a dangerous phase. The U.S. is less than six months from elections, while China is facing acute Bubble fragility. But as serious as the threat of this escalating “war” is to global finance, growth and the “world order” more generally, U.S. markets remain short-term focused. The assumption is President Trump will not risk pushing this confrontation too far ahead of November – all bark, no bite. Markets further assume vulnerabilities in China will restrain Beijing’s reaction to Trump’s animus.

Yet faltering Bubbles ensure great uncertainty. I’ve always believed a bursting Bubble would see China directing blame at the U.S. (along with Japan). Beijing has employed significant stimulus in repeated moves to hold crisis at bay. Bubbles only inflated larger. At this juncture, it’s doubtful such measures will work, while the Trump administration has really ratcheted up hostilities. Fanning anti-U.S. public vitriol throughout China today requires minimal effort. So, it’s not a completely inopportune juncture for Beijing to take some tough medicine and begin focusing on financial and economic restructuring. It would be painful, but communist party leadership can deflect blame upon the global pandemic and America.

The Trump administration’s tough approach with trade negotiations created animosity and a breakdown of trust. There are indications that Beijing’s “hawks” have gained influence. I would anticipate an increasing amount of intransigence out of Beijing. The move to a bipolar world will accelerate. And don’t expect Beijing to sit back and watch the Trump administration work to shift global supply chains to the U.S. without adopting strong countermeasures.

If the direct consequences of the global pandemic weren’t enough, this crisis comes at such a critical juncture. The unstable geopolitical backdrop is turning increasingly problematic.

The Brazilian real dropped another 2.1% this week, as a troubling economic and financial backdrop is compounded by Brazil becoming a global COVID hot spot. EM currencies were again under pressure, with the Czech koruna declining 2.1%, the Hungarian forint 1.8%, the South African rand 1.3%, and the Mexican peso 1.3%. Asian currency weakness saw the Singapore dollar and South Korean won drop 1.0% and 0.9%. Declining 0.4%, China’s renminbi is nearing March lows versus the dollar.

Global bank stocks were under notable pressure again this week. U.S. banks were clobbered 9.8%, trading Thursday to the lows since April 2nd. European banks (STOXX 600) were smashed 6.8%, trading back to March lows. The Hang Seng China Financials Index dropped 2.6% this week, trading Friday at the low since early April. Japan’s TOPIX Bank Index fell 2.7%, trading to a three-week low.

Global bank Credit default swap (CDS) prices moved meaningfully higher this week. Goldman Sachs (5yr) CDS jumped 15 bps to 116, a six-week high. JPMorgan CDS rose 14 bps to a six-week high 87. BofA CDS rose 14 bps (to 90), and Citigroup nine bps (to 105). Other notable increases included Wells Fargo up 21 bps (to 101), Morgan Stanley 14 bps (to 104), Commerzbank 17 bps (to 97), UniCredit 14 bps (to 192) and Intesa Sanpaolo 14 bps (to 190). I would take the signal being provided by bank stocks (corroborated by safe haven bond yields) over that from Nasdaq.

May 15 – Bloomberg (Jesse Hamilton and Rich Miller): “The Federal Reserve issued a stark warning Friday that stock and other asset prices could suffer significant declines should the coronavirus pandemic deepen… The Fed made the assertion in its twice-yearly financial stability report, in which it flags risks to the U.S. banking system and broader economy. The document highlighted the central bank’s race to intervene in markets and temporarily dial back regulations on financial firms in response to the Covid-19 crisis. ‘Asset prices remain vulnerable to significant price declines should the pandemic take an unexpected course, the economic fallout prove more adverse, or financial system strains reemerge,’ the Fed said…”

It would appear probabilities have increased for COVID-related risks remaining elevated for months to come. From the Bubble analysis perspective, this would seem to ensure a scenario where economic fallout proves more adverse than generally expected. Securities and asset prices are acutely vulnerable. And I would further argue the Fed-induced market rally over recent weeks has only exacerbated systemic fragilities. Global Bubbles are Deflating, with far-reaching consequences.

http://creditbubblebulletin.blogspot.com/2020/05/weekly-commentary-global-bubbles-are.html

Here’s 5 Reasons Why Gold Miners Have Massive Outperformance in the Tank

May 15, 2020 By Bryce Coward, CFA in Economy, Knowledge Leaders, Portfolio Management

As I write this note on a dreary Friday afternoon from Boulder, CO I am reminded of my town’s origin. Its first non-native settlers established the town 1858 as a base camp for gold and silver miners. Nestled literally at the foot of the Rockies, its location was ideal for supplying the Colorado mining boom at that time and by 1871 a railroad had been built to connect Denver, Golden, Boulder and the mining operations directly to the West of Boulder. One such mining operation was in what is still known as Gold Hill, which I highly recommend visiting for a live music and BBQ event the next time you are in Colorado (COVID permitting).

Today we may be in the early days of a different kind of gold boom. This time the boom isn’t because there are new gold reserves to be dug out of the ground. Rather, the steady supply of gold compared to the extraordinary growth of new money requires that the dollar value of the former must rise to keep parity with the latter. Indeed, the US money supply has grown by approximately 23% over the last 65 days, or about a 90% annualized rate. No wonder the price of gold is sitting near a cycle high of $1743/oz as of this writing. But even as the price of gold has risen in recent months, the gold miners themselves may be even larger beneficiaries of the US dollar supply shock. Below, we’ll list 5 simple reasons the gold miners could be in for a period of massive outperformance.

  • The price of gold miners relative to the price of gold is basically at a 25 year low. This implies quite a catch up trade if the price of the commodity produced by the miners remains at elevated levels or even rises from here. The price performance of the miners would have to outperform the price of gold by 500% to reach the old 2011 highs in relative performance.
  • The relative performance of gold miners relative to the S&P 500 remains at near a 25 year low. Gold miners would have to outperform the S&P 500 by 400% to get back to the 2011 highs in relative performance.
  • Valuation. Based on the price to EBITDA ratio (and about all the other valuation ratios), gold miners are cheaper than the overall market. From 2005-2016 gold miners pretty much always traded at a premium to the S&P 500, but now the miners are trading at a 15% discount.
  • Liquidity. In the age of COVID, stocks with the ability to service their debt obligations should arguably trade at a premium to the market. The gold miners have a current ratio (current assets/current liabilities) nearly twice that of the S&P 500 as a whioe (2.06 vs 1.28).
  • Solvency. In the age of COVID, stocks with balance sheets in line with their income statements should arguably trade at a premium to the market. The gold miners have debt to EBITDA about 75% lower than the overall market (1.16 vs 4.69).
  • Bonus chart. The global aggregate market value of gold miners is $260bn. This compares to the aggregate market value of the FAAMG (Facebook, Amazon, Apple, Microsoft, Google) stocks of $5.4tn and the market value of US Treasury debt outstanding of $25tn. So the gold miners, in aggregate, are worth about 5% of the value of just those 5 FAAMG stocks and 1% of the value of all the Treasury debt outstanding. What do you think would happen to the price of the gold miners if some of that capital left the FAAMGs or Treasury bonds and flowed into the gold miners?

YOU NEED TO OWN GOLD MINER, NOT GOLD BARS

via Capitalexploits.at

We’ve already discussed why commodities are so damn cheap. Now we are going to address why you need to own mining stocks and not just physical silver and gold.

In this article and video I discuss: https://youtu.be/PD4FTuY4LgI

  • The leading indicator of a precious metals bull market;
  • The advantages of own stock in a mining company vs. physical bullion;
  • The downsides to physical metals and ETFs;
  • Why not all miners are created equal; and
  • How much money can you really make?

The Signal for a Precious Metals Bull Market

Today, the gold to silver ratio is higher than it has been since 1968 (as far back as my data goes). The ratio is over 100:1, meaning that you can buy more than 100 ounces of silver with one ounce of gold.

A ratio above 80 exceeds the 90th percentile of the historic data, indicating that silver is extremely undervalued. 

Because 50% of annual silver production is used for manufacturing, the metal indicates when deflationary cycles are coming to an end by showing when relative valuation reaches extreme levels. This manufacturing component makes the price of silver more volatile than gold in bull markets. 

The other 50% of global silver production goes towards demand as a store of value, which makes the ratio to gold all the more comparable.

Below is a visualization of the last three bull markets in precious metals overlaid with the gold to silver ratio.

How to Buy Silver & Gold?

Bullion

There are several ways to benefit from a precious metals bull market. The first way is to simply buy bullion, which typically takes the form of gold or silver coins and bars. The benefit of owning physical metal is that you know exactly what you have and it can be traded as needed. The downside is that you will most likely pay a premium due to the costs associated with shipping, protecting, and storing your precious bullion.

To make matters worse it’s difficult to buy physical bullion today unless you are willing to buy a gold bar worth roughly $600,000. Smaller denominations are experiencing shortages due to supply shutdowns and mass demand in the midst of Covid-19.

ETFs

Another way to invest in precious metals is to buy a gold or silver ETF. This is much easier than buying physical gold and provides exposure to the price swings of the underlying metal. 

Precious metals ETFs are based on gold or silver derivative contracts such as futures, so you never actually hold the gold you buy, even in the event that the ETF is liquidated. Another drawback to ETFs is that you’ll likely end up paying management fees. 

Miners

Lastly, you can do what I do, and buy mining stocks. In a bull market there is no better way to play precious metals than owning stock in a well-run mining company with great assets. 

Mining stocks are just as easy to buy or sell as an ETF, but offer much greater upside potential. You can own part of a company that is producing hundreds of thousands of ounces a year and potentially has millions of ounces in the ground, or is on the cusp of making a new discovery. 

This provides you with leverage

Leverage is a financial strategy where you borrow money to increase your risk, but also return potential, in an investment. In this case, the mining companies are the ones who have borrowed and investors own a share of that company. 

When precious metal prices are falling, you own a share of the debt and operating costs, meaning that you will likely lose more money than if you simply owned the physical commodity. 

But, in a bull market (like we are experiencing today)… 

You own a share of the profits from production and the ounces still in the ground. In this scenario the company’s leverage will give you access to higher returns compared to the price of the underlying commodity.

Now let’s compare the performance of mining stocks to silver and gold prices during recent precious metals bull markets.

A Recent History of Outperformance

Period 1: May ‘03 – March ‘08

First, let’s look at the 5-year precious metals bull run of the early 2000’s following the tech bubble. Silver returned investors over 330% during this period, but the investors with the biggest wins were those that invested in silver miners. 

Below is a chart showing a handful of silver companies compared to the price of silver (in black). Many miners returned investors more than 500%. 

MAG Silver returned investors over 2,500% during the period, and over 3,000% at its peak.

A similar scenario can be seen in the gold sector. 

It’s important to note that many miners underperformed, this was due to many mining companies placing hedges against falling gold prices. They’d done this for several years prior to the bull market in an attempt to protect shareholders from the depressed prices, but at the end of the day it came back to haunt them, and cripple their share price.

Even still Newcrest Mining delivered nearly 500% returns, compared to 192% gold price returns.

Period 2: November ‘08 – April ‘11

During the 3-year precious metals bull market following the Global Financial Crisis, silver once again outperformed gold, returning ~400% and 100% respectively. During this period, Wheaton Precious Metals returned investors over 1,400%, while many other companies returned over 700%.

Gold miners showed investors more than double the returns made on physical gold.

While investing in mining companies you can deliver multiples to investors not all companies are created equal. 

Only companies with high quality assets led by capable teams deliver truly excellent returns. The rest are just a flash in the pan. 

If you want to see how we manage our own capital, and the gold mining companies that I’m investing in, check out Resource Insider and sign-up for our free email list here.  

Antifragile or Die

We all know that supply chains are badly affected by the coronavirus induced crisis. But what is it about supply chains that we can learn from firms that seem to have weathered it and are prospering.

1.Just in Time works till it suddenly doesn’t

2.Safety stock and building up of reserves is important.

3.Account for the risk that single source and faraway suppliers pose.

Now dealing with all of the above means higher costs but also higher automation.

But what is the payoff?

Apparently Huge.

One can compare it to having an out of the market put which pays off spectacularly during times of crisis allowing you to bulldoze your competitor similar to getting high returns and thereby having more cash to invest at a time when everything is dirt cheap.


At agricultural machine manufacturer Grimme, production has continued at all its factories throughout the entire coronavirus shutdown.

Grimme has consistently refused to adhere to modern-day management principles, such as the idea that large industrial manufacturers must produce globally and outsource services to remain as flexible and efficient as possible. Damme has frequently examined whether such an approach would work for the company, but has always chosen to go another direction.
The company, if you will, is more old school, preferring to produce as much as it can at home, particularly critical parts like screens and reels. In-house production depth, a reference used by economists to measure how much a company makes itself, is around 85 percent. “We’ve always been laughed at because of it,” says Feld. Now, though, the erstwhile critics have become envious.
Whereas competitors such as Claas and Fendt have been forced to shut down their production lines, Grimme has become something of an avant-garde in the agricultural machinery industry and is indeed setting a trend for the economy as a whole.
A survey conducted by the association in mid-April found that 89 percent of companies have experienced clear hindrances to normal business operations. Supply chains, as has once again become apparent, are only as strong as their weakest link.

That, indeed, is the flip side of de-globalization: Bringing things home increases security but it raises costs and shrinks profit margins. Still, the price of independence can, perhaps, be minimized — using cheap labor and technology.

References

https://www.spiegel.de/international/world/future-of-our-global-economy-the-beginning-of-de-globalization-a-126a60d7-5d19-4d86-ae65-7042ca8ad73a

We are all Govt sponsored enterprises now

Scott Minerd , CIO at Guggenheim Partners has a very unique way of thinking. He writes in his outlook….

Eight weeks have passed since the Federal Open Market Committee held an extraordinary Sunday meeting and cut the fed funds rate to zero. Since then the Federal Reserve (Fed) and Congress have unleashed vast fiscal and monetary resources to support the economy and financial markets. I have my opinions on the efficacy and long-term consequences of those policies, but as an investor, I do not have the luxury of moralizing. My job is to understand how markets function, assess value in whatever conditions we find ourselves, and position client portfolios accordingly.


Our portfolios reflect the view that we are likely going to be facing a long period of repression in the yield curve, and that the risk of significant widening in high-quality credit spreads has been reduced by the market’s faith in the Fed’s new facilities. As a result, we believe our conservative positioning before the crisis has positioned us well to aggressively take advantage of market dislocations and opportunistically add credit exposure.

Interest rates are not likely to skyrocket anytime soon despite massive Treasury issuance. Given the economy’s and U.S. Treasury’s need for continued support by the Fed, utilizing bond buying and forward rate guidance will, over time, continue to exert downward pressure on rates. I see the yield on the 10-year Treasury note falling to 25 basis points or lower very soon, with a possibility that it will go negative in the intermediate term—our target is -50 basis points, and in certain circumstances it could go meaningfully lower. The long bond could ultimately reach around 25 basis points as the 10-year and 30-year area of the curve shifts down by over 100 basis points from where it is today.

Treasury Yields Are Heading Even Lower From Here

10-Year U.S. Treasury Yield (Quarter End)

Treasury Yields Are Heading Even Lower From Here

Source: Guggenheim Investments, Haver Analytics, Bloomberg. Data as of 5.7.2020.

The Fed’s and Treasury’s expanded support for credit markets and corporate borrowers has significantly reduced tail risks in pricing. Liquidity provided by the Fed will keep prices in check for a wide range of securities. It has also removed some of the hazards that lead to default, such as being shut out of the market when in need of money. Prior to the March 23 announcement of the Primary and Secondary Market Corporate Credit Facilities (PMCCF and SMCCF), it was unclear if companies like Boeing would be able to raise money in primary credit markets at any affordable level. But on April 30, Boeing raised $25 billion on a deal that was met with $70 billion in orders, making it the sixth largest corporate bond placement on record. In fact, investment-grade corporate bond issuance this year has broken the previous monthly record twice, with March volume of $262 billion breaking the previous record in May 2016 of $168 billion, and April volume of $285 billion breaking March’s record. Year-to-date investment-grade bond issuance through April totals $765 billion, putting 2020 on track to easily surpass last year’s total of $1.1 trillion.

Many companies, including Boeing, Southwest, and Hyatt Hotels, have likely gained access to financing simply on the strength of the government’s intentions to intervene in credit markets. Successful debt offerings have also been completed by recent fallen angels like Ford and Kraft Heinz, both of which had corporate bonds trading at or near distressed levels only weeks ago. This was a real success for corporate bond issuers, but it was also a success for the Fed.

The Fed has yet to buy a single bond in the SMCCF, but the mere announcement of the program has managed to tighten credit spreads dramatically and greatly ease liquidity issues. This reminds me of the period between 1942 and 1951, a period in which the Fed targeted a maximum rate of 2.5 percent on long-term Treasury bonds. Amazingly, the Fed ended up buying only a small amount of Treasury debt during that period. The reason, of course, is that the market perceived that the Fed had given Treasury investors a put. Any time rates began to approach 2.5 percent, investors would step in and start buying because there was very little downside. A similar dynamic is at work right now in the credit markets.

The support on offer to corporate America during this period of economic shutdown risks the creation of a new moral obligation for the U.S. government to keep markets functioning and help companies access credit. This means that corporate borrowers are most likely on the way to becoming something akin to government-sponsored enterprises (GSEs) like Fannie Mae and Freddie Mac. The difference is that in this cycle, it is not a specific institution that is too big to fail, it is the investment-grade bond market that is too big to fail.

Before the financial crisis of 2007-08, Fannie Mae and Freddie Mac operated with the implied backing of the U.S. government, and the senior securities they issued—mortgage-backed securities and Agency debentures—were referred to as moral obligations of the U.S. government. There was no legal requirement for the U.S. Treasury to pay off or guarantee their senior securities, but during the extreme conditions of the financial crisis, when liquidity dried up for the Agencies’ securities and their capital position deteriorated, the Treasury stepped in. The Fed played its part, with the first de facto quantitative easing (QE) program taking the form of outright purchases of Agency discount notes and, ultimately, the U.S. Treasury offered its unconditional guarantee on Agency mortgages and debentures, which ended in conservatorship. The implicit support that the markets and rating agencies had relied upon for years to justify their pricing and low capital charges turned out to be correct. Fannie and Freddie actually were an obligation of the U.S. government, and the government made good on it.

Rating agencies and regulators had long assigned value to the implicit government support that led to similar treatment for Agency debt as that of U.S. Treasury obligations. If the rating agencies believe that these pandemic programs are going to reduce default risk then it logically follows they will be slower to downgrade companies (or may, under certain circumstances, consider upgrading them). That does not mean every company is going to get bailed out, or that every bad credit will be turned into a good credit, but at the margin some questionable credits will not only have lower risk of default, but they will also have lower risk of downgrade and pay lower rates of interest.

What could go wrong with my outlook? We are already in uncharted territory and another black swan might emerge in the midst of a very fragile market. Or a second-order event could create irreversible damage such as large default volumes in the emerging markets. Risks from reopening the economy are two-sided: State and local governments could ease up on lockdown restrictions, the spread of the virus could prove to be manageable, and the economy could come roaring back—unlike what we’ve predicted, which is more of a checkmark-shaped recovery than a V-shaped recovery. On the other hand, the easing of restrictions could lead to a second spike in the coronavirus that is even worse than what we have already lived through, leading to a new leg down for the economy and markets.

Another risk is the Treasury itself. The Fed will need to conduct another $2 trillion of QE this year to keep the Treasury market functioning given the size of the deficit. Net coupon issuance for the rest of 2020 will approach $1.5 trillion, and net bill issuance could add another $2 trillion. There is just not enough available credit in the world to absorb all of these Treasury securities without crowding out other borrowers. If at some point markets begin to question the efficacy of QE, or the Federal Reserve is perceived to be behind the curve in making necessary asset purchases, we could very well get a tantrum in the Treasury market, which would likely spill over into a tantrum in corporate credit, and into the stock market.

Treasury Issuance Will Shatter Records in 2020

New Marketable Treasury Issuance

Treasury Issuance Will Shatter Records in 2020

Source: Guggenheim Investments, Haver Analytics, U.S. Treasury. Data for 2020 are Guggenheim’s Forecast. Data as of 5.6.2020.

Any of these risks could affect my outlook. But as Americans we will need to have more faith in the willingness and the ability of our government to print money as the ultimate solution to every problem. In extreme conditions, the real function of central banks is to print money when necessary to make sure the government gets financed. This is the dirty little secret of central banking. Central bankers won’t openly admit to this, but we have seen this reaction function time and time again, and in every cycle it only gets bigger.

The policy of the central bank to continually step in, lower interest rates, and encourage companies and people to take on more debt has been in place since the 1930s. The idea that the central bank could push interest rates down and make more credit available to smooth out the business cycle is designed to have an economy that operates with fewer recessions, less severe recessions, and ultimately longer periods of expansion. This policy worked, but it also created the Great Debt Supercycle: Every time we get ourselves into a recession, the total debt of the U.S. economy rises relative to gross domestic product (GDP) to new and higher levels. This is not sustainable in the long run, even if we are able to push interest rates into significantly negative positions on a sustained basis.

Policy Drives the Debt Supercycle

U.S. Nonfinancial Debt to GDP

The Fed’s Balance Sheet Comes to the Rescue

Source: Guggenheim Investments, Haver Analytics. Data as of 12.31.2019.

“We are all Keynesians now” is the famous phrase attributed to Richard Nixon during the financial crisis of 1971 as a sign of his reluctant acceptance of an economic theory he found objectionable. I understand how he must have felt. I see lower interest rates coming and tighter credit spreads ahead. There may be hiccups along the way, but the resetting of valuations across most sectors has presented attractive opportunities and prompted us to significantly increase credit exposure. Our confidence is based on thorough credit analysis and informed relative value assessment. But it is also based on my reluctant acceptance of the policy framework that is now in place.

https://www.guggenheiminvestments.com/perspectives/global-cio-outlook/we-are-all-government-sponsored-enterprises-now?utm_source=pardot&utm_medium=email&utm_campaign=government-sponsored%20enterprises&utm_content=global%20cio%20outlook

Global Market Commentary and Outlook

Trends across Asset classes


Summary
After March’s deep sea of red ink, April dispensed a relief rally in no small degree. The biggest winner last month: US equities, which surged 13.2% (Russell 3000 Index). That still leaves American shares under water by more than 10% year to date, but as rebounds go, the April bounce was the strongest monthly gain for stocks in decades.
For the year so far, losses still dominate. The exceptions: cash, inflation-indexed Treasuries and a broad measure of US investment-grade debt, primarily due to Treasuries. Gold is also in the winner’s circle so far in 2020: the precious metal is posting a solid 11.1% year-to-date gain.


Happy couple of the month and as they say one picture can say a thousand words.

Analysts and former government officials see an erosion of the Fed’s traditional independence from politicians in the White House and Congress, as well as a central bank straying from monetary policy — the supply of dollars — into tax-and-spend fiscal policy. The risk is that “fiscal dominance” of the Fed could raise inflation or create currency and banking crises down the road, said Mark Sobel, who was a civil servant at Treasury for more than 40 years. “This crisis is blurring the boundaries between fiscal and monetary policy,” he said.-(BnnBloomberg.ca)


What lays ahead for the Federal Reserve
The rapid decline in stock prices that we just saw was a large deflationary impulse.  The Federal Reserve’s primary purpose is to address and solve this type of problem. The Fed is tasked with providing liquidity and fighting deflation
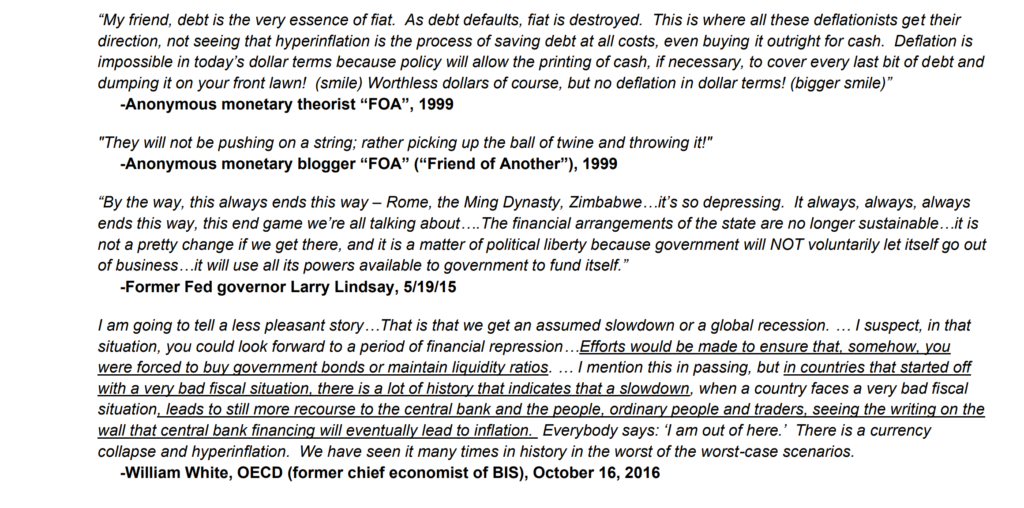
The only thing holding it all together is the Fed and its ability to expand credit.  Chairman Bernanke assured us that a determined Fed could always address and solve the issue of deflation with Helicopter money. The problem is the amount being printed will get bigger and bigger because all the new debt needs to be serviced. Furthermore, if buyers and holders of US Government debt decide they have better places to put their money other than US Treasuries, then interest rates will rise (i.e., less bond demand combined with greater US Treasuries supplied = lower bond prices & higher yields).   But this is a real problem because higher interest rates increase the deficit requiring even MORE DEBT.  So, the FED will have to buy even more of the government bond market (e.g., issue more credit/print more money) in order to keep interest rates in check.  Can you see where this is leading?  This is a classic doom loop.  Printing money leads to more inflation, which leads bond holders to sell, which leads to the need for more printing.  Eventually, when the Fed is printing money so rapidly that its value is disappearing daily then they will have another problem: hyperinflation, but that will be the hot topic of discussion late next year
This is why I say the Fed is trapped – it’s a pick your poison game for them of
(i)                  Doing nothing = deflation & bad recessions
vs.
(ii)                Monetizing deficits but at the risk of debasing the dollar and runaway inflation
The US Government’s solution to every problem is spend money/run deficits, issue more US Treasury Bonds, and as necessary have the Fed “print more money” to monetize deficits in the absence of institutional and foreign US Treasury buyers.  The perception is that this is cost free.  And for a while, that has appeared to be somewhat correct.  But there will surely be a cost.  We just have not seen it yet.  That moment will occur when everyone becomes aware that the only policy choice is to print money and that it will never be reversed.  Then the cost will show up in the purchasing power of the dollar.
Printing money, in extremis, will lead to the dollar becoming worthless.  Then the “music will stop”, and the rush out of the dollar will be on.  Just like the German Reichsmark in 1923.  In my opinion, the dollar still has value only because of tradition and recency bias.
If and when faith in the dollar begins to wane, the best indicators will be the dollar price of gold, which has been rising at 11% pa since 2015.  Now at ~ $1,700 per ounce, it will achieve an important level when it takes out the 2011 high of $1,900.
Source:Morgan Stanley research

Outlook

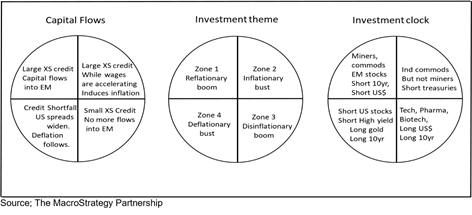
In the forthcoming cycle, the US authorities have a choice; inflation or bust? In my view, they are choosing inflation. Global excess US$ liquidity is now approaching ‘reflationary boom’ territory
The Fed’s balance sheet will expand by 38 % of GDP, more than the 20 percentage points during QE1, 2 and 3 combined.

But ultimately inflation is never caused by just one thing. It is a concatenation of supply side shocks that undermine the welfare of the median worker. It is the series of government driven demand side shocks that seek to offset those effects. And it is the impact of all of those on investor, corporate and consumer psychology that sets off a self-reinforcing inflationary process.
Today’s supply side shocks are individually less obvious than the oil crisis in the 70s. But, collectively, monopoly, globalisation, the end of Moore’s law and the costs of the green agenda etc have, in my view, delivered an even greater blow to the median Western worker’s welfare than the ‘70s oil shock. Lockdowns have accelerated the effect. The global authorities’ response to the supply shocks and the lockdowns is extreme.
I estimate that the Fed’s QE, its various loan & credit facilities and the Treasury’s forthcoming fiscal spend, will together inject liquidity equivalent to five QE1s & a QE2 in just one year. This will not be business as usual; in the coming cycle, I anticipate sustained reflationary policy from the Fed, a handover of Fed control of money supply to the US Treasury, persistent structural deficit spending, a debasement of the dollar and a redistribution of global income growth from the ‘billionaire class’ to the ‘US$10k worker’. All are inflationary. (Julien Garren Macrostrategy partnership)

History shows that once a bull market in the gold stocks gets started it often has a long way to run.  Note where we are in the current bull market should be adjusted up about 35% since this chart was compiled before the Summer 2019 rally.  Nevertheless, all gold bull markets post 1942 have provided returns of 300-700%. I believe the gold bull market we are currently in will outperform all of these prior examples.


More Concentration, Large Size and more Monopoly in the fray?

In the coming years we will deal with another side effect of Fed’s loose monetary policies, which can be seen as the Cantillon effect resulting in more mergers and buybacks.
Amazon, Facebook, Microsoft, Google maybe the poster boys of monopolisation of America but it is a wide and deep phenomenon across industries.
But what are the consequences ?

1.       As Organizations grow larger, they become more bureaucratic, less agile and driven by cannibalization as evidenced by IBM’s buyback record driving share prices higher while the organizations core revenue and business suffers.
2.       Monopolies lower productivity across the economy by reducing the amount of credit being available as a whole to newer business models and being less agile as they seek to entrench their rent seeking positions.
3.       Take the word of google which finds it easier to buy in new capabilities by acquiring firms rather than developing it inhouse.
4.       They ultimately sap out Medium and Small Business which lowers the overall employment levels and thereby their demand base.

Now why does all of this matter ?

It’s because we have very highly concentrated rallies in equity markets and as the productivity effects of these organisations catches up with them, along with public opinion against them we will see a step function decrease in their earning levels along with drum roll of antitrust weighing in on these stocks.
One fifth of the S&P 500’s market cap is accounted for by five big tech companies, marking the highest level of concentration for the index since the 2000 tech bubble, when equity market concentration stood at 18%, according to a note published by Goldman Sachs.
We also had Mr Larry Fink raising the spectre of higher corporate tax rates as he forecasts that only corporations will have the relatively stronger balance sheet as opposed to the Broke general public and overburdened balance sheets elsewhere.
So, while Coronavirus has driven these stocks to newer highs, cycles have a tendency to regularly break these patterns in ways that makes people look like fools every decade.
But, to estimate where we are regarding the monopolisation peaks one may have to look at anecdotal evidence which tend to become flashpoints in history. The recent handling of coronavirus related outbreaks and conditions in Amazon, Tyson foods etc seem to indicate that this trend has peaked, as labour movements are starting to pick up and the proverbial cycle will now turn in favour of labour.
 

To Oil or not to Oil ?
Oil is trading in a range which will bankrupt and close down a lot of supply from shale and other sources. Once the demand destruction takes hold properly, we expect just in time supply demand mechanics to kick in to equilibrate supply and demand.
On various metrics, oil is undervalued and will rise back up again in terms of price as demand picks up. But, not before making a lot of oil supply unable to come online when demand increases even modestly.

This dynamic and its current range provides significant value in the future taking into account low to moderate demand expectations as well.
What we are thereby going to see is further consolidation among all the large players who will be very well placed for when the demand comes back and other capacities shut off.
 
I will close with a quote from Stanley Druckmiller for the people who are getting surprised at the rebound in equities
The major thing we look at is liquidity, meaning as a combination of an economic overview. Contrary to what a lot of the financial press has stated, looking at the great bull markets of this century, the best environment for stocks is a very dull, slow economy that the Federal Reserve is trying to get going… Once an economy reaches a certain level of acceleration… the Fed is no longer with you… The Fed, instead of trying to get the economy moving, reverts to acting like the central bankers they are and starts worrying about inflation and things getting too hot. So it tries to cool things off… shrinking liquidity… [While at the same time] The corporations start having to build inventory, which again takes money out of the financial assets… finally, if things get really heated, companies start engaging in capital spending… All three of these things, tend to shrink the overall money available for investing in stocks and stock prices go down…
Druck has also said:
Earnings do not move the overall market; it’s the Federal Reserve Board… focus on the central banks and focus on the movement of liquidity… most people in the market are looking for earnings and conventional measures. It’s liquidity that moves markets.
 
 
8th May 2020