The Complacency Bubble- Incrementum AG

Enclosed please find the transcript of Incrementum AG fantastic Q3 Advisory Board meeting, discussing the “Complacency Bubble” that we are currently in. Their special guest this quarter was Simon Mikhailovich. Simon is a contrarian investor and entrepreneur. 

During the call they discussed

  • How the Fed has already created hyperinflation.
  • How the US might have to enter a new arms race.
  • Why a market crash is not the biggest risk to the US economy and what is the biggest risk actually?
  • Why US rates will go lower, and why European rates will become even more negative.
  • Read the PDF of the Advisory Board Transcript here

Charts That Matter- 22nd Aug

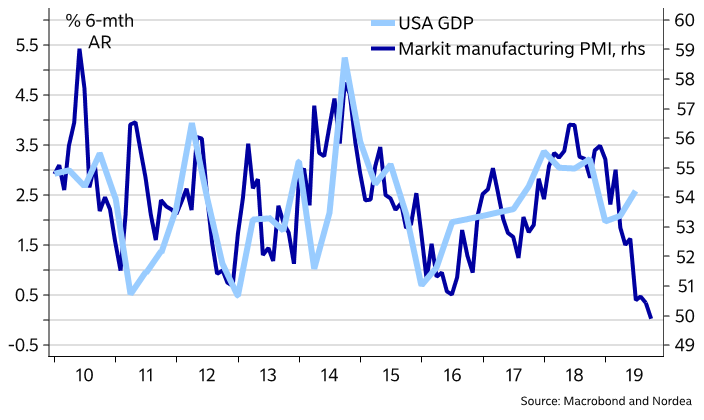
If Donald Trump’s aides and advisors are looking for signs that the US economy is about to roll over ahead of an election year, they can take a gander at the flash read on IHS Markit’s factory gauge.

Unfortunately, it sank into contraction territory for the first time in nearly a decade, printing 49.9, down from 50.4 in July and 54.7 a year ago.

It was the lowest read since September 2009.

Image

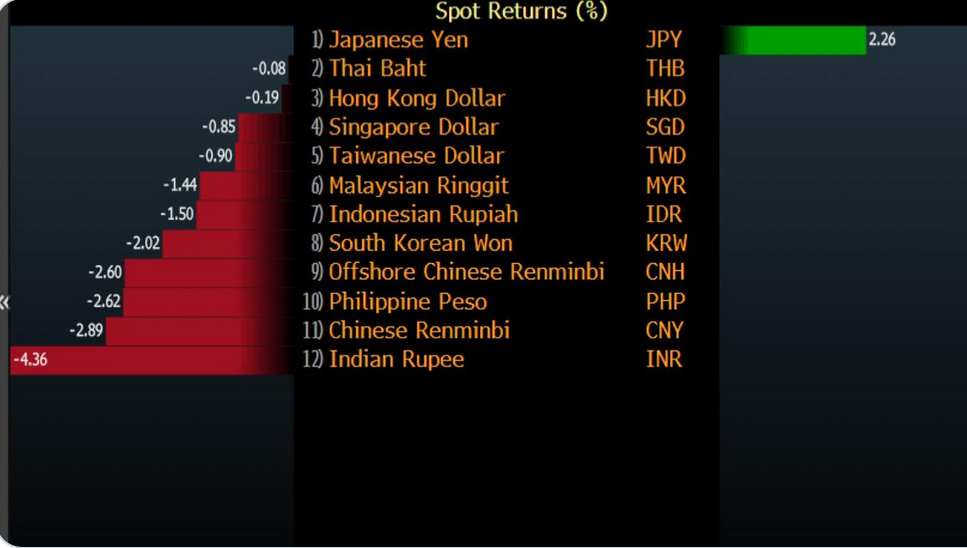
Move on CNY…..Rupee is the worst performer MTD

Asian Month to date FX spot

Rupee

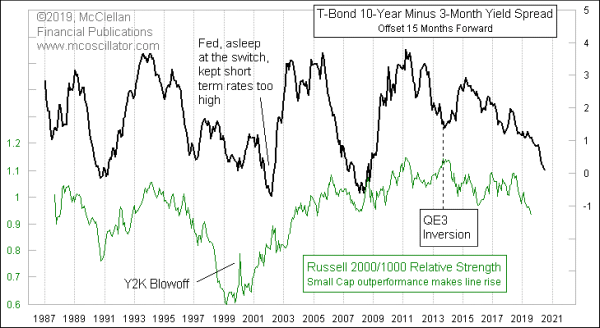
Tom Mccllelan writes “The chart below shows the relative strength ratio for the Russell 2000 Index versus the Russell 1000.  Also in the chart is the spread between the 10-year T-Note yield and the 3-month T-Bill yield, which is one of the common ways of showing the “yield curve”.  The trick in this chart is that the yield spread’s plot is shifted forward by 15 months in order to show how the R2/R1 relative strength ratio tends to follow in the same footsteps after that lag time.  This is relevant now because the R2/R1 relative strength line has been moving lower, indicating that small cap stocks have been underperforming large ones on a relative basis.  And the continued drop in the 10-3 spread says that this underperformance of the small caps is likely to continue for the next 15 months.

Enable Images to see chart or view in browser

Junk bond spread to the broader index are blowing out to highest level since 2016. Via @lisaabramowicz1

Image

India’s ‘One-Trick-Pony’ Growth May Not Turnaround Anytime Soon

Rajiv Malik explains

“There is no reason to think growth is going to turn around anytime soon. We could clearly be down in the dumps for longer simply because my main assessment for India remains—it’s like a truck with a messed-up gearbox. You can change the tires, you can paint it, you can do wonderful things, but will you get the gearbox going?”

To a large extent, India’s growth was predominately a one-trick pony, relying on private consumption which had been held up in large part by debt financing and post the NBFC crisis late last year, a lot of unraveling has taken place. So, after three-four years of strong private consumption growth, there is a natural tendency of momentum to slow down.

Read more at: https://www.bloombergquint.com/economy-finance/consumption-slowdown-indias-one-trick-pony-growth-not-going-to-turnaround-anytime-soon-says-rajeev-malik
Copyright © BloombergQuint

FASANARA CAPITAL OUTLOOK | No-Bond World And The Risk Of A Daily Liquidity Crisis

Fasanara Capital writes

First, the ‘nocebo effect’ of negative interest rates. In medicine, the nocebo effect is opposite to a ‘placebo effect’, insomuch that it depicts the phenomenon in which inert substances or mere suggestions of substances actually bring about negative effects in a patient. As a market participant, if I know that lending does not yield much, but may entail untraditional levels of risks, I do not lend. I wait and see what happens first. As a borrower, if I feel the economy is so desperate as to be in need of endless non-sensical negative rates, I do not borrow. What can be the prospects in an economy in need of dramatic measures. Having flipped completely upside down the lending and borrowing scheme, by messing around with the price of money, creates a market economy that leaves economic agents wandering and waiting on the side-lines. They go to sleep, like Snow White after biting the red apple.
In that, enduring negative rates are deflationary. Thus, in a vicious cycle, defeating the purpose for which they are introduced.”

LINK

How to identify a consensus

Alex writes for macro-ops https://macro-ops.com/how-to-identify-the-consensus/

Here’s John Percival, writing in his book The Way of the Dollar, describing how to identify the Consensus and act as a Contrarian. 

“Remember the last time you sold a currency at what proved to be the bottom, or bought at the exact top? That wasn’t just bad luck — nor even just foolishness. You and the crowd caused the bottom, or the top. 

The Consensus. 

I know of one top equity fund manager who has no other rule for handling the currency markets than to go against the consensus. It’s common sense. We must be ‘contrarians’, if we are to survive in financial markets in general and the currency markets in particular. During the great bull market in the dollar in 1981-5, it was the one single rule that assured survival. If you have any problem with that, I suspect there is no solution but to observe markets till it’s no longer a problem; for the shifts from pessimism to optimism and back are what bull and bear markets are about. 

The difficulty is to define “the consensus”. The crowd isn’t always wrong. When a price movement gets going, the crowd as often as not will line up in the direction of the movement. But standing against the crowd, at times can be as desirable as standing in the way of an express train. This is the drawback of such objective measures of opinions as Market Vane — a well known American service which measures bullish opinion among traders. If you poll traders, most of them will point in the direction of the trend. Bullish opinion as measured by Market Vane tells us the direction of prices over the past week, but not necessarily a lot more. 

Perhaps Bruce Kovner, of Caxton, nailed the problem when he said that what he was looking for was the consensus that is not confirmed by price action. That covered the entire 1981-5 bull market in the dollar when the consensus was constantly bearish. It also covers the price extremes, when the consensus is wrong by definition. 

Whether we are looking at the underlying multi-month/ multi-year trend or the intermediate multi-week moves, there are usually two phases when the consensus is not confirmed by price — early in the move and at the end of the move. Soon after a price reversal, majority opinion is usually aligned with the previous trend, i.e. the consensus lags. Similarly, majority opinion strengthens along with the on-going trend, trending to reach peak consensus at the price extreme. So the ideal position is to be contrarian at the beginning and end of a move, and pro-consensus in the middle. Nice work if you can get it so right. 

Never forget that the consensus 

usually includes you.

The consensus gauge is a subjective gauge. We read the papers and specialist commentators and we talk to people, and we conclude that most punters are facing one way. If we are facing the same way, we have to reconsider the situation in the light of our other sentiment gauges and cut back if they are flashing yellow. In the heat of a powerful favourable price move, we are often lulled into complacency: at that point, consulting the consensus is an essential discipline — it often comes as a shock to discover that we are in with the herd, and it can be very costly if we fail to make this discovery. When we diagnose a situation where the consensus is not confirmed by price, we should not just cutback but try facing the other way, to see whether anything clicks. If the market action feels right; if the open interest is extended; and if we can find a fitting rationale, we can reverse our position… 

Helpful Images

There is another description of the consensus-that’s-not-confirmed-by-price. It consists of two images that have become part of the ancient lore of Wall Street, the Wall of Worry and the River of Hope. A bull market we recall, “climbs a wall of worry” ; and “a bear market flows down a river of hope”. In point of fact, the description normally only applies to the early and middle stages in bull and bear markets. So we can be very comfortable when we diagnose a wall or a river — assuming we’re climbing and flowing respectively. 

In the later stages of the trend, things change. The worriers capitulate to the up-trend; and the hopers throw in the towel and give up the fight against the bear. At this stage, in a bull market, we find die-hard bears saying that, well, we are heading for a collapse, but prices are going to go up further before they head down. And in a bear market die-hard bulls assert that prices are far too low — but they can go lower still. The conversion process is nearing its end. Now we have to get a little wary, for obviously we are in the region of consensus. And this is a very dangerous region because nobody on earth can tell how far things can go. Currencies, stocks, commodities — it makes no difference. In this respect they’re all the same. 

It is said of Joseph Kennedy, father of President John Kennedy, that when he was having his shoes shined one day in autumn 1929, he was astonished to hear the shoe shine boy tip him a hot stock that was sure to go from 160 to 2000 or whatever. That was all Joe K needed. If shoe shine boys (or elevator attendants, or hairdressers, the cover of Newsweek or whatever) were tipping stocks, it was time to get out. So Joe K started selling short and thus laid the foundation of the family fortune — so the story goes. But if it’s true that Joe K went short at that moment then he was lucky. The sucker buys at the top of the market; geniuses and liars sell at the top of the market; but the super-sucker sells short at what he thinks is the top of the market. 

In 1979, the then financial editor of Britain’s Daily Mail newspaper, Patrick Sargent (later to be a founder of Euromoney), called the top of the gold market at around $450. It was a perfectly sound call, in the light of the speculative heat in gold at the time especially from one who had been bullish of gold for a good time. Yet gold was to climb a further $400 by early 1980, when speculation turned from red-hot to white-hot. Imagine being short at $450! As I say, no-one on earth knows where a speculative trend will end — except with hindsight… 

This brings us to the question how you can distinguish a minor multi-week extreme from a major multi-month or multi-year extreme. The late stages in that great dollar bull market of 1980-5 provide a clue: you watch the way the conversion process trickles down through the different categories of currency observers. In mid-1984, the world was still full of die-hard dollar bears who had considered the currency overvalued ever since 1981. Who were they? It wasn’t the dealers, who are not and do not need to be overly concerned with underlying value; nor was it the trend-followers. It was the value-oriented analysts — researchers and economists by profession — with a long-term orientation. What happened was that some time during the autumn of 1984, the bearish consensus among this category turned round; and it happened relatively suddenly. You will see it quite clearly if you go back over the research material turned out by major banks at the time. “The dollar is grossly overvalued at DM 3.00, but we think it will head further up before it collapses”, that kind of thing. 

In other words, it’s just as you would expect. When the long-termers who were formerly skeptical at last capitulate to the trend, then you have a total consensus and the end is nigh for the major multi-month / multi-year move. Nigh, but not necessarily over. At this point one of our sentiment gauges comes into its own. We have to watch market action: the way the markets react in relation to the background and to news events.”

Michael Lewis wrote in his book Liar’s Poker that: 

Everyone wants to be, but no one is, for the sad reason that most investors are scared of looking foolish. Investors do not fear losing money as much as they fear solitude, by which I mean taking risks that others avoid. When they are caught losing money alone, they have no excuse for their mistake, and most investors, like most people, need excuses. They are, strangely enough, happy to stand on the edge of a precipice as long as they are joined by a few thousand others…

It’s incredibly difficult to identify the consensus and act as a contrarian in markets. A good first step is to acknowledge that you suffer from the same base cognitive impulses that drive the rest of the herd — we’re ALL part of the Dumb Money crowd. 

As soon as you accept this, you can then go about learning some tools to help you step back from the crowd and better understand the popular narratives and emotions that are driving prices. Doing so is more art than science and it takes a lot of work. But it’s better than standing on the edge of a precipice… 
The ALIBABA Investor Call…….Trade War?…What Trade War?

Deep Throat writes…..

Deploying our patented Dick Fuld Banker Speak Translator (BST) here’s how Maggie really meant to answer Grace’s question if she were fully transparent:

Maggie Wu — Chief Financial Officer Thank you, Grace, for the question. Yes, it’s true, our margins have improved at an unbelievable pace through this last quarter.  We are brilliant accounting professionals to be sure. The improvement is due primarily from our analysis of all the money we’ve wasted building software, marketing, kickbacks and dumb-ass projects that just don’t work, probably never will and are not yet being used by anybody.  Since it’s so cutting edge, we’ve determined that, even though it’s “useless shit” (technical term) right now, we’ve capitalized all of the costs, payroll and kickbacks associated with these projects because, by definition, if these payments don’t benefit the business in the current quarter, they will surely benefit the business sometime in the future.  In any event, we are amortizing the cost of all of these tiny, immaterial projects scattered over our 1,300 consolidating operating entities (so PWC can’t possibly figure this out) over 5 years rather than expense these costs in the current period, as we had been incorrectly doing in prior quarters.  Lucky we caught it!  Also, Joe told me that I had to “hit the number or else my next vacation will be in Xinjiang” so we came up with this cockamamie crock of steaming turds of an accounting change, ran it by PWC, increased their fees and just hope that dumb-ass US Investors don’t catch on to what we’re doing.  Anyway, I’m safe in China so if that ungrateful bastard Jay Clayton has any problem with what we’re doing, after all of the fees we paid him at Sullivan & Cromwell, he and his SEC and that pain in the ass FBI can stick their subpoenas “where the sun don’t shine”.

read full article below

https://deep-throat-ipo.blogspot.com/2019/08/the-baba-investor-calltrade-warwhat.html

The latest sign that absolutely nothing makes sense- Simon Black

In the latest sign that absolutely nothing makes sense anymore, WeWork filed formal regulatory paperwork with the Securities and Exchange Commission last week, officially notifying the world that it will soon be going public.

If you haven’t heard of WeWork (or it’s parent– ‘The We Company’), it’s a real estate company that owns practically zero real estate.

Instead, they lease vast amounts of office space in commercial buildings on long-term contracts, and then sub-lease that space to individual tenants– often small businesses– with short-term contracts.

It’s essentially the same business model as Regus– which provides virtual office services, business addresses, and short-term office space, in pretty much every major city around the world.

Yet Regus is actually profitable. Its parent company, UK-based International Workspace Group, reported a profit of nearly 300 million British pounds (about $350 million USD) for the first six months of 2019. And the company consistently makes money.

read full article below

Charts That Matter-19th Aug

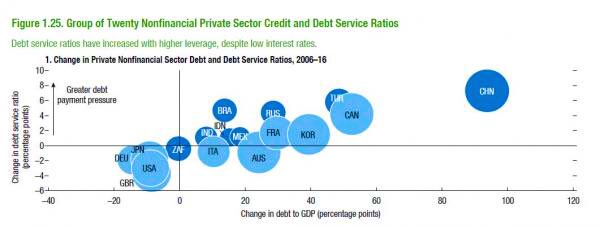
The USD shortage + higher short term rates + stronger USD has put (especially) Chinese firms with significant dollar-denominated debts in a fragile position (because 2+ trillion in debts matures over next 24months) . The more USD rally the more difficult is USD loan rollover

Image

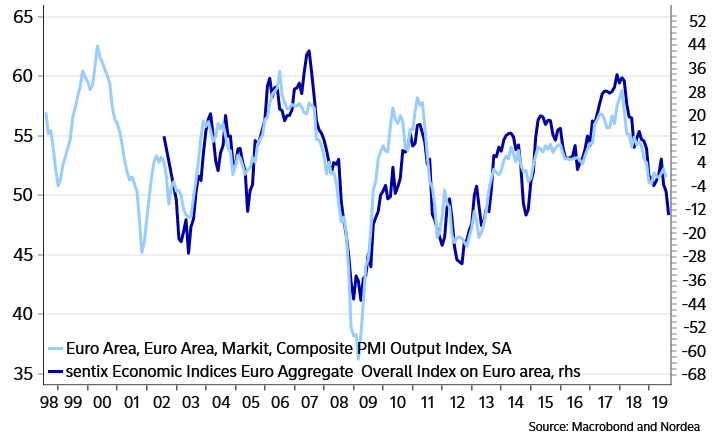
The Bundesbank warns of a technical recession in Germany. Nordea warn of the risks of a Euro area wide technical recession then. The Euro area composite PMI could drop below 50 over the next 2-3 months.

FX weekly -> ndea.mk/33HxWYs

Image

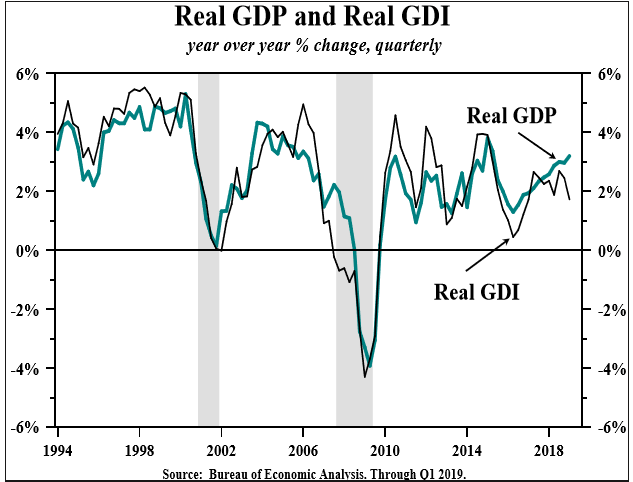
US Real gross domestic income (GDI) gained at a very meager 0.76% annual rate in Q4 2018 and Q1 2019, well below the 2.65% growth in real GDP (Chart 2). Over the past year, real GDP growth was 3.2%, versus 1.7% for GDI, hardly ebullient growth. Normally, GDI and GDP have moved together going into recessions but prior to the severe recession in 2008, GDI led GDP, just as presently, a clear warning sign. Dr Lacy Hunt

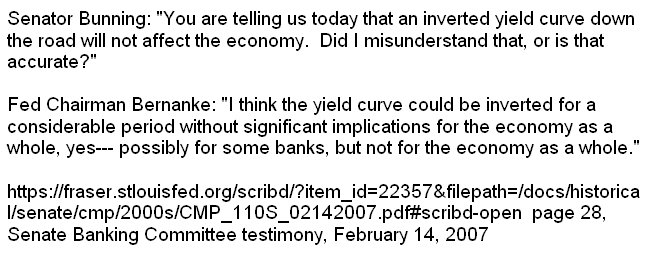
why is it never different

Ben Bernanke, on subject of inverted yield curve, in 2007. That turned out well.

Image

Quarterly Review and Outlook- Lacy Hunt

Lacy Hunt is the authority on bond markets and he concludes in this must read piece

Accordingly, monetary restraint is continuing to weigh on economic growth. Inflation, which fell below the Fed’s targets and most Wall Street forecasts, will remain on a downward path. These cyclical forces suggest that inflationary expectations should continue to fall this year and next as the economic growth rate weakens further. This means that a mild recession would push the real rate into negative territory. Thus, both determinants of the nominal long risk-free rate (i.e. the real rate and inflationary expectations) are directionally favorable for further interest rate declines, although the path will continue to remain volatile.

http://www.hoisington.com/pdf/HIM2019Q2NP.pdf

Charts That Matter-16th Aug

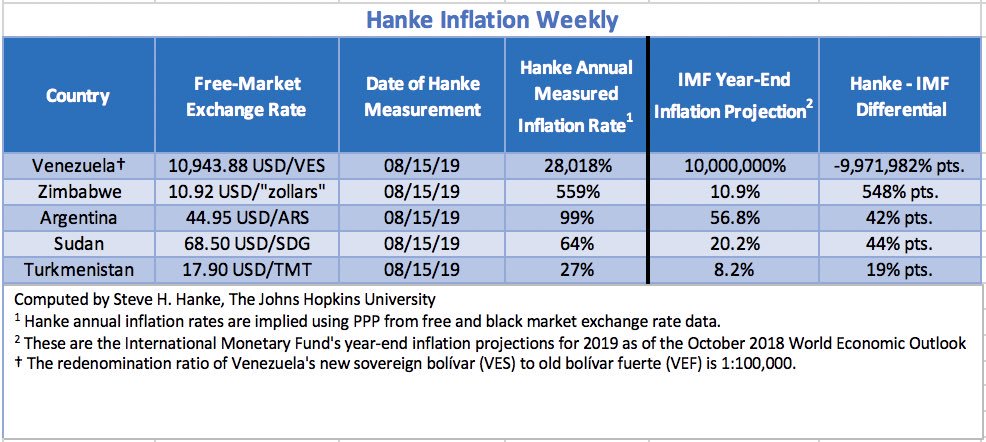
Zimbabwe has suspended the reporting of government inflation statistics until Feb. 2020. Hanke is the only source for Zimbabwe inflation, which is, by his measure, 559%/yr today. Zimbabwe sky-high inflation ranks 2nd in the world behind only hyperinflating Venezuela.

Image

The tariffs are hurting U.S. consumers. Here’s Goldman Sachs’ analysis of what’s happened to prices of goods covered by tariffs. Ugly.

Image

By One Measure, Investors Have Never Been More Worried About The Future.

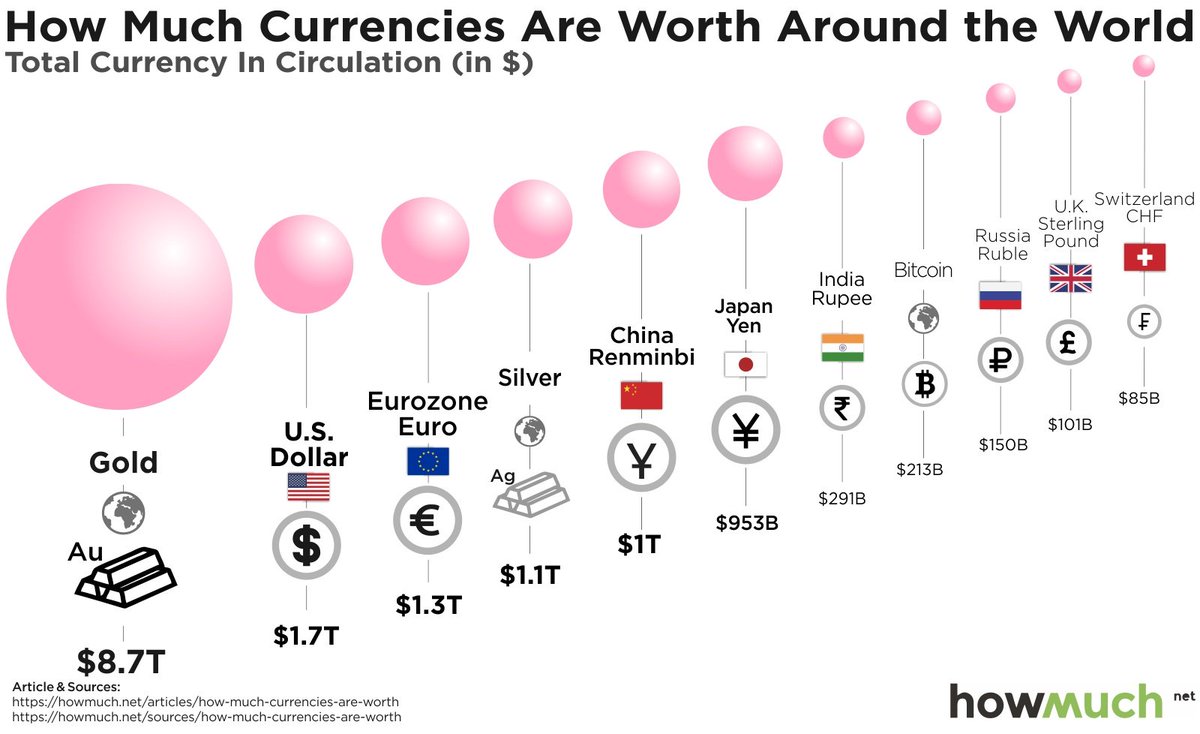
Currency Wars: Stacking Up The World’s Largest Currencies dlvr.it/RBLrX9

Image