Charts That Matter-24th July

IMF growth estimates

US growth estimate for 2019 revised up by 0.3% to 2.9%.

FED does not need to cut but a rate cut will stimulate the economy. If that were not enough President trump can now increase fiscal spending heading into election in 2020 as debt ceiling is now abolished till next US presidential election.

Lower Taxes+ Easing Monetary Policy+ Loose Fiscal policy=Higher GDP growth.

Our Brave new world:

Why Nestlé is a quality stock trading at a PE of 29 v. Daimler now trading in the “value” category with a PE of 8! (link: https://www.economist.com/finance-and-economics/2019/05/18/beneath-the-dull-surface-europes-stockmarket-is-a-place-of-extremes) economist.com/finance-and-ec…

Image

Price up, supply down.

Existing-home sales fell 1.7% to a seasonally adjusted annual pace of 5.27 million, the National Association of Realtors said Tuesday. Sales declined 2.2% compared with a year earlier, marking the 16th consecutive month of annual declines in sales.The spring selling season is crucial because about 40% of the year’s sales take place in March through June. Falling sales during most of this period have puzzled economists. They struggle to explain why the housing market has remained soft while the rest of the economy has been booming.

Borrowing rates have fallen to their lowest levels in two years, wages are rising and unemployment is at a 50-year low.

“It doesn’t make economic sense,” said Lawrence Yun, the NAR’s chief economist.  – WSJ

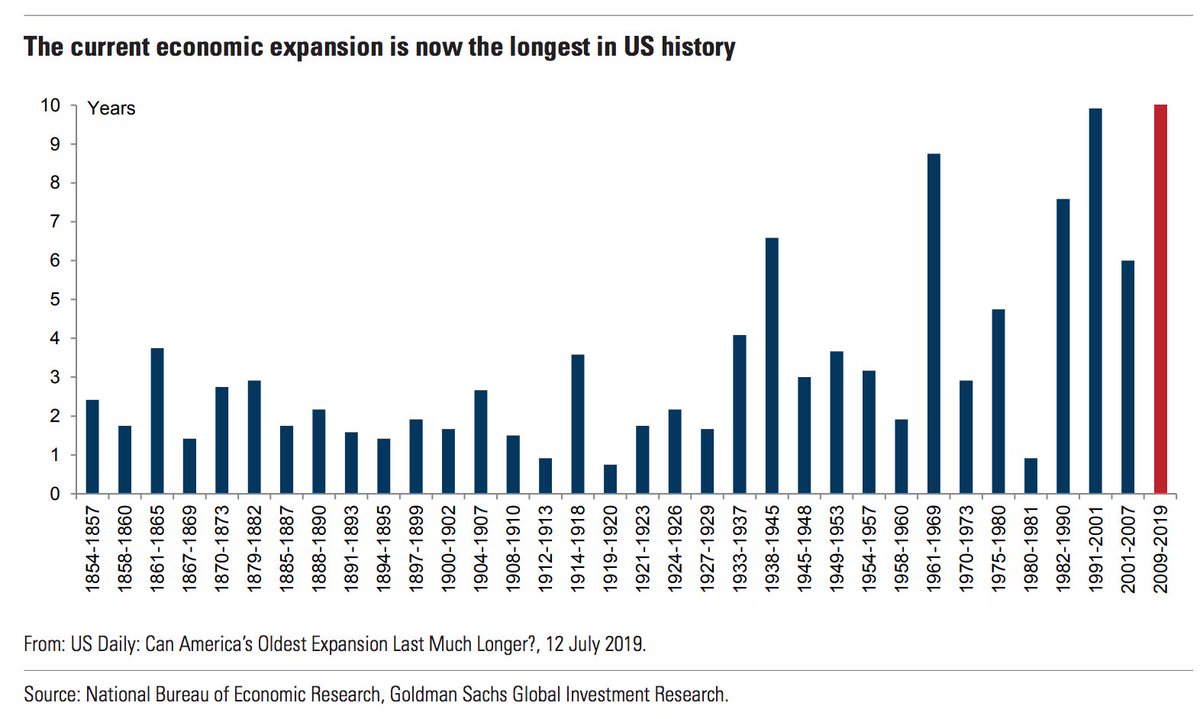
The Longest expansion just got longer

US has now reached longest econ expansion in history. 2 main triggers of past recessions—inflationary overheating & private sector imbalances—not flashing red, Goldman says. Even trade pol will not be major hit to growth. Goldman expects US to remain in solid shape after weakerQ2
Image

This is Water

Ben hunt writes in Epsilon Theory

Financialization is the zombiefication of an economy and the oligarchification of a society.

Here’s the foundational chart for these strong words.

This is a 30-year chart of total S&P 500 earnings divided by total S&P 500 sales. It’s how many pennies of earnings S&P 500 companies get from a dollar of sales … earnings margin, essentially, at a high level of aggregation. So at the lows of 1991, $1 in sales generated a bit more than $0.03 in earnings for the S&P 500. Today in 2019, we are at an all-time high of a bit more than $0.11 in earnings from $1 in sales.

read full article below

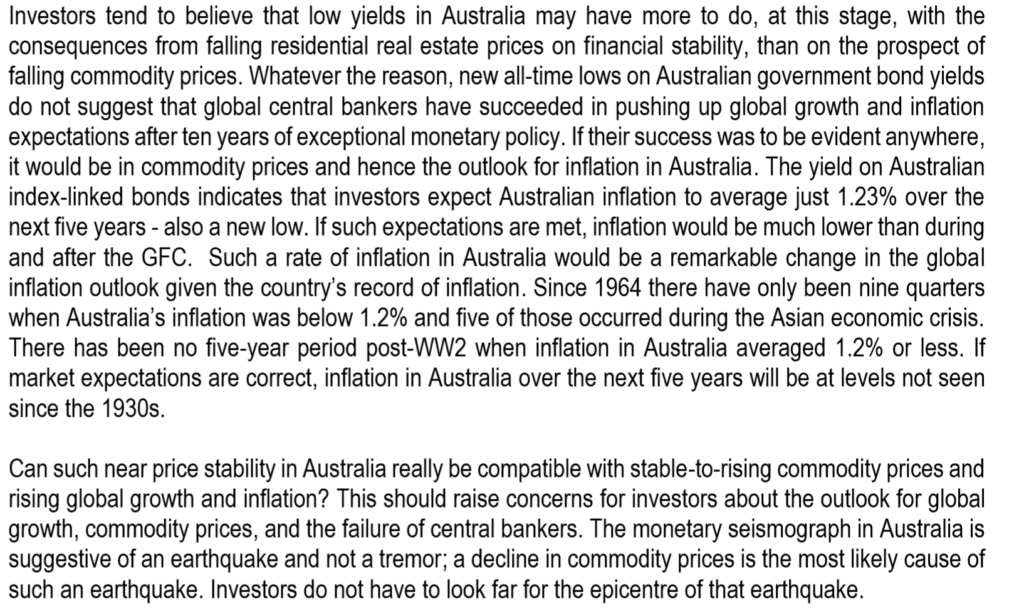
The Jolt of The Needle – Record Low Bond Yields & The Earthquake That Follows.

Russell Napier writes for Solid Ground…

‘Of all the recording devices that can reveal to an historian the fundamental movements of an economy, monetary phenomena are without doubt the most sensitive. But to recognize their importance merely as symptoms would do them less than full justice. They have been and are, in their turn, causes. They are something like a seismograph, which not only measures the movements of the earth but sometimes provokes them.’

Marc Bloch: “Le Probleme de l’or au Moyen Age”; Annales d’Histoire Economique et Sociale; 1953 Across the world many key government bond yields have fallen below both their 2009 and 2016 lows. In 2009 the market thought the world financial system was collapsing and a deflationary depression was imminent. Unless of course one had read Anatomy of The Bear: Lessons From Wall Street’s Four Great Bottoms! In 2016 the market thought that China was about to devalue its exchange rate and key, large commodity producing companies were on the verge of bankruptcy. These were both dark times but not so dark as to push key global bond yields to current levels.

As a financial analyst one is often asked, “Where do you see financial bubbles today?” When risk-free rates are this low it is easy to see them everywhere, but of course the biggest bubble must be in those so-called ‘risk free rates’ themselves. Remember these are the ‘risk-free’ assets many financial institutions are forced to hold to reduce their balance sheet risk! In the remainder of this newsletter we will look at what such low rates are telling us, why commodity prices will now move sharply lower, why Australia is heading for big trouble, and why US Treasuries are a buy.

Russell explains beautifully the importance of Australia’s low bond yield and its implication for rest of the world

read full article below ( Subscription required)

https://www.eri-c.com/news/234

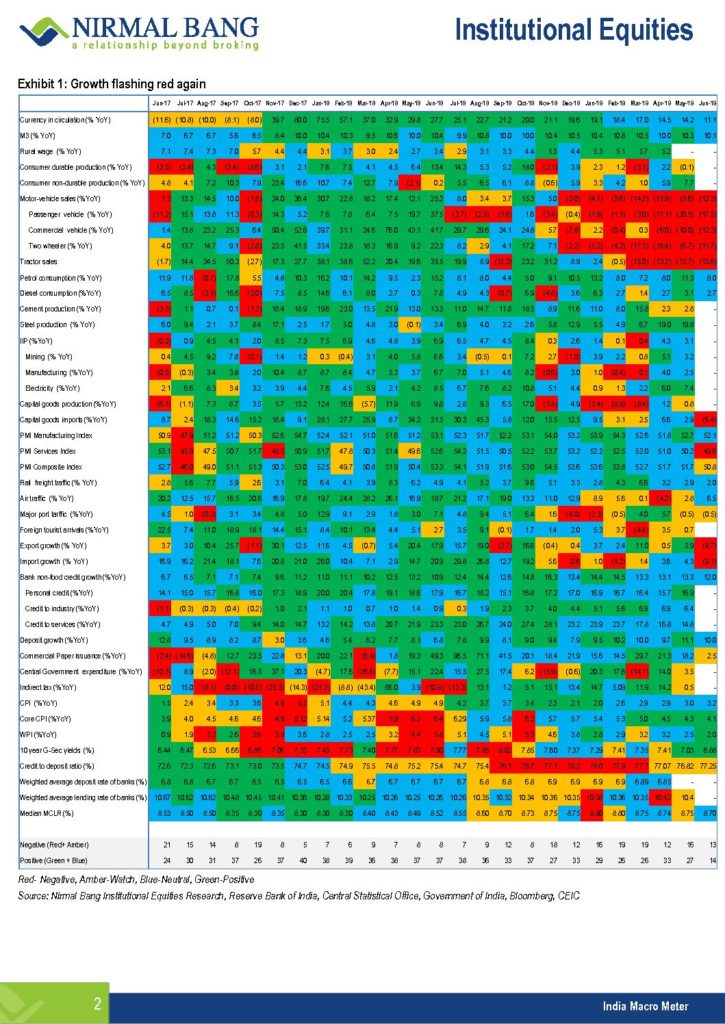
India Macro Meter- Deteriorating

May ’19, 62.8% of indicators were in positive territory, down from the 66.7% suggested by early indicators.

However For June’19, only 51.85% of indicators are in positive territory, which is only slightly better than the sub-50% readings registered in the aftermath of demonetisation.

Automobile, two-wheeler and tractor sales continued to slump.

Charts That Matter-23rd July

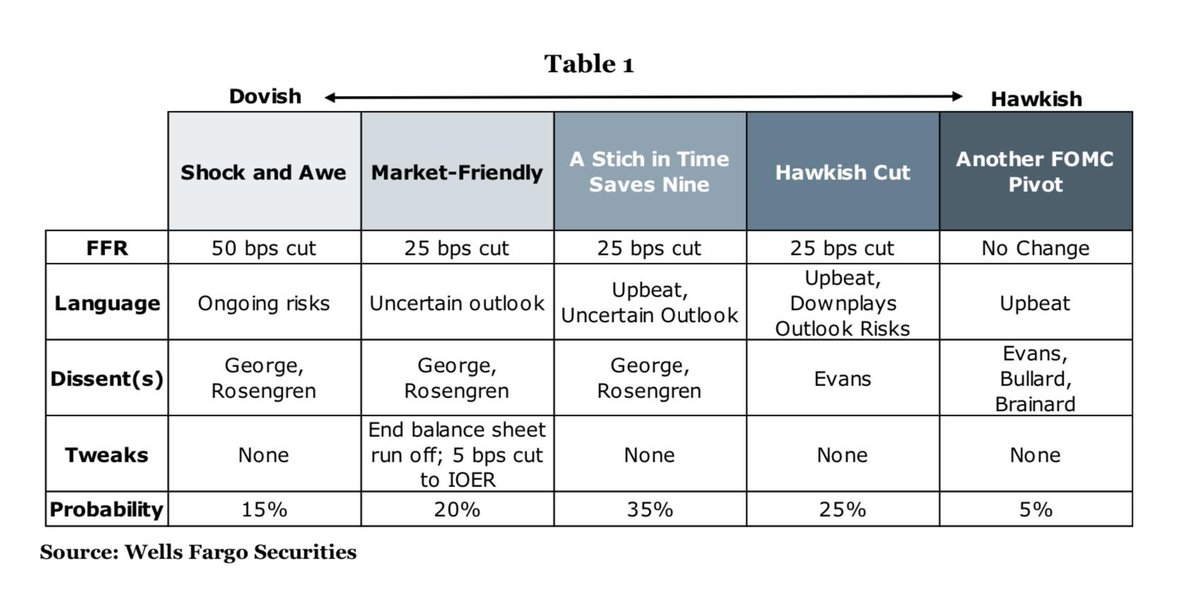
Pick and choose your poison. An economy which is growing at 3% and an unemployment rate of less than 4% will see rate cuts in next week Fed meeting. We are truly on the verge of a currency war

Image

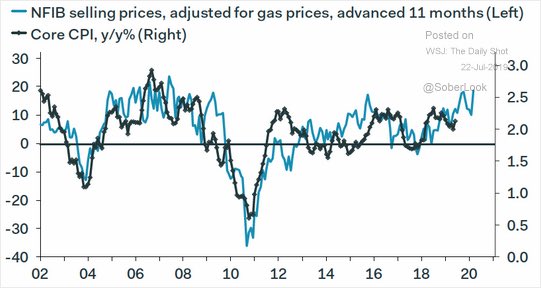
Small business selling prices suggest higher inflation to come @PantheonMacro@SoberLook

Image

BusinessInsider: “Covenant-Lite Leveraged Loans in Europe now 90% of Total” Bloomberg: Japan’s Central Bank owns 77% of the ETF market Central banks: “We tried Penicillin, then morphine, then Opioids, but nothing cured the patient’s broken arm?’

Image

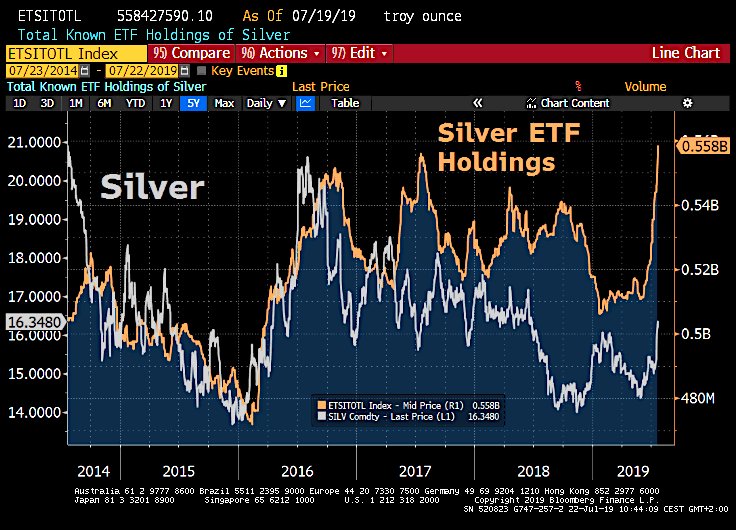
Silver ETFs holdings have hit fresh all-time as investors are betting that silver will catch up with the performance of Gold. These kind of price chasing along with 91% bullish sentiment amongst traders normally leads to a violent pullback or consolidation for sometime.

Image

How Gold Bulls Begin: The Process Explained

Gwen Preston writes for investing.com….

There’s a reason gold stocks move so much in a bull market: the market is tiny. The global gold market has a combined capitalization of about U$225 billion – the entire gold business is smaller than a single company in the S&P’s top 30.

That means when generalist capital rotates in, there aren’t a lot of places for it to go. And so a lot of dollars pile into a few places.

Where are those places?

To start, generalist capital interested in gold goes to gold-backed ETFs and the biggest of the major miners.

That’s clearly underway already. Recently, the SPDR Gold Shares (NYSE:GLD) ETF, which is the biggest of the gold-backed funds, saw $1.6 billion in inflows, including the biggest one-day haul since the fund started in 2004.

Miners are also moving. In the last month the NYSE Arca Gold Miners Index is up 25%; half of those gains happened since the Fed meeting on June 19.

Gold-backed ETFs and major gold miners remain preferred destinations throughout a gold bull market. But other kinds of companies soon get attention, too.

Next in line are mid-tier miners, single asset operators, developers, and optionality plays. Those are all self explanatory aside from the last category.

Optionality plays are companies with large assets that would not make a lot of sense to mine at low gold prices but that make tonnes of sense once gold rises. That move – from not economic to economic – is a game changer for the asset and therefore for the company.

As such these stocks outperform in a rising gold market. They’re called ‘optionality’ plays because they are like buying options – they are a call on a higher gold price.

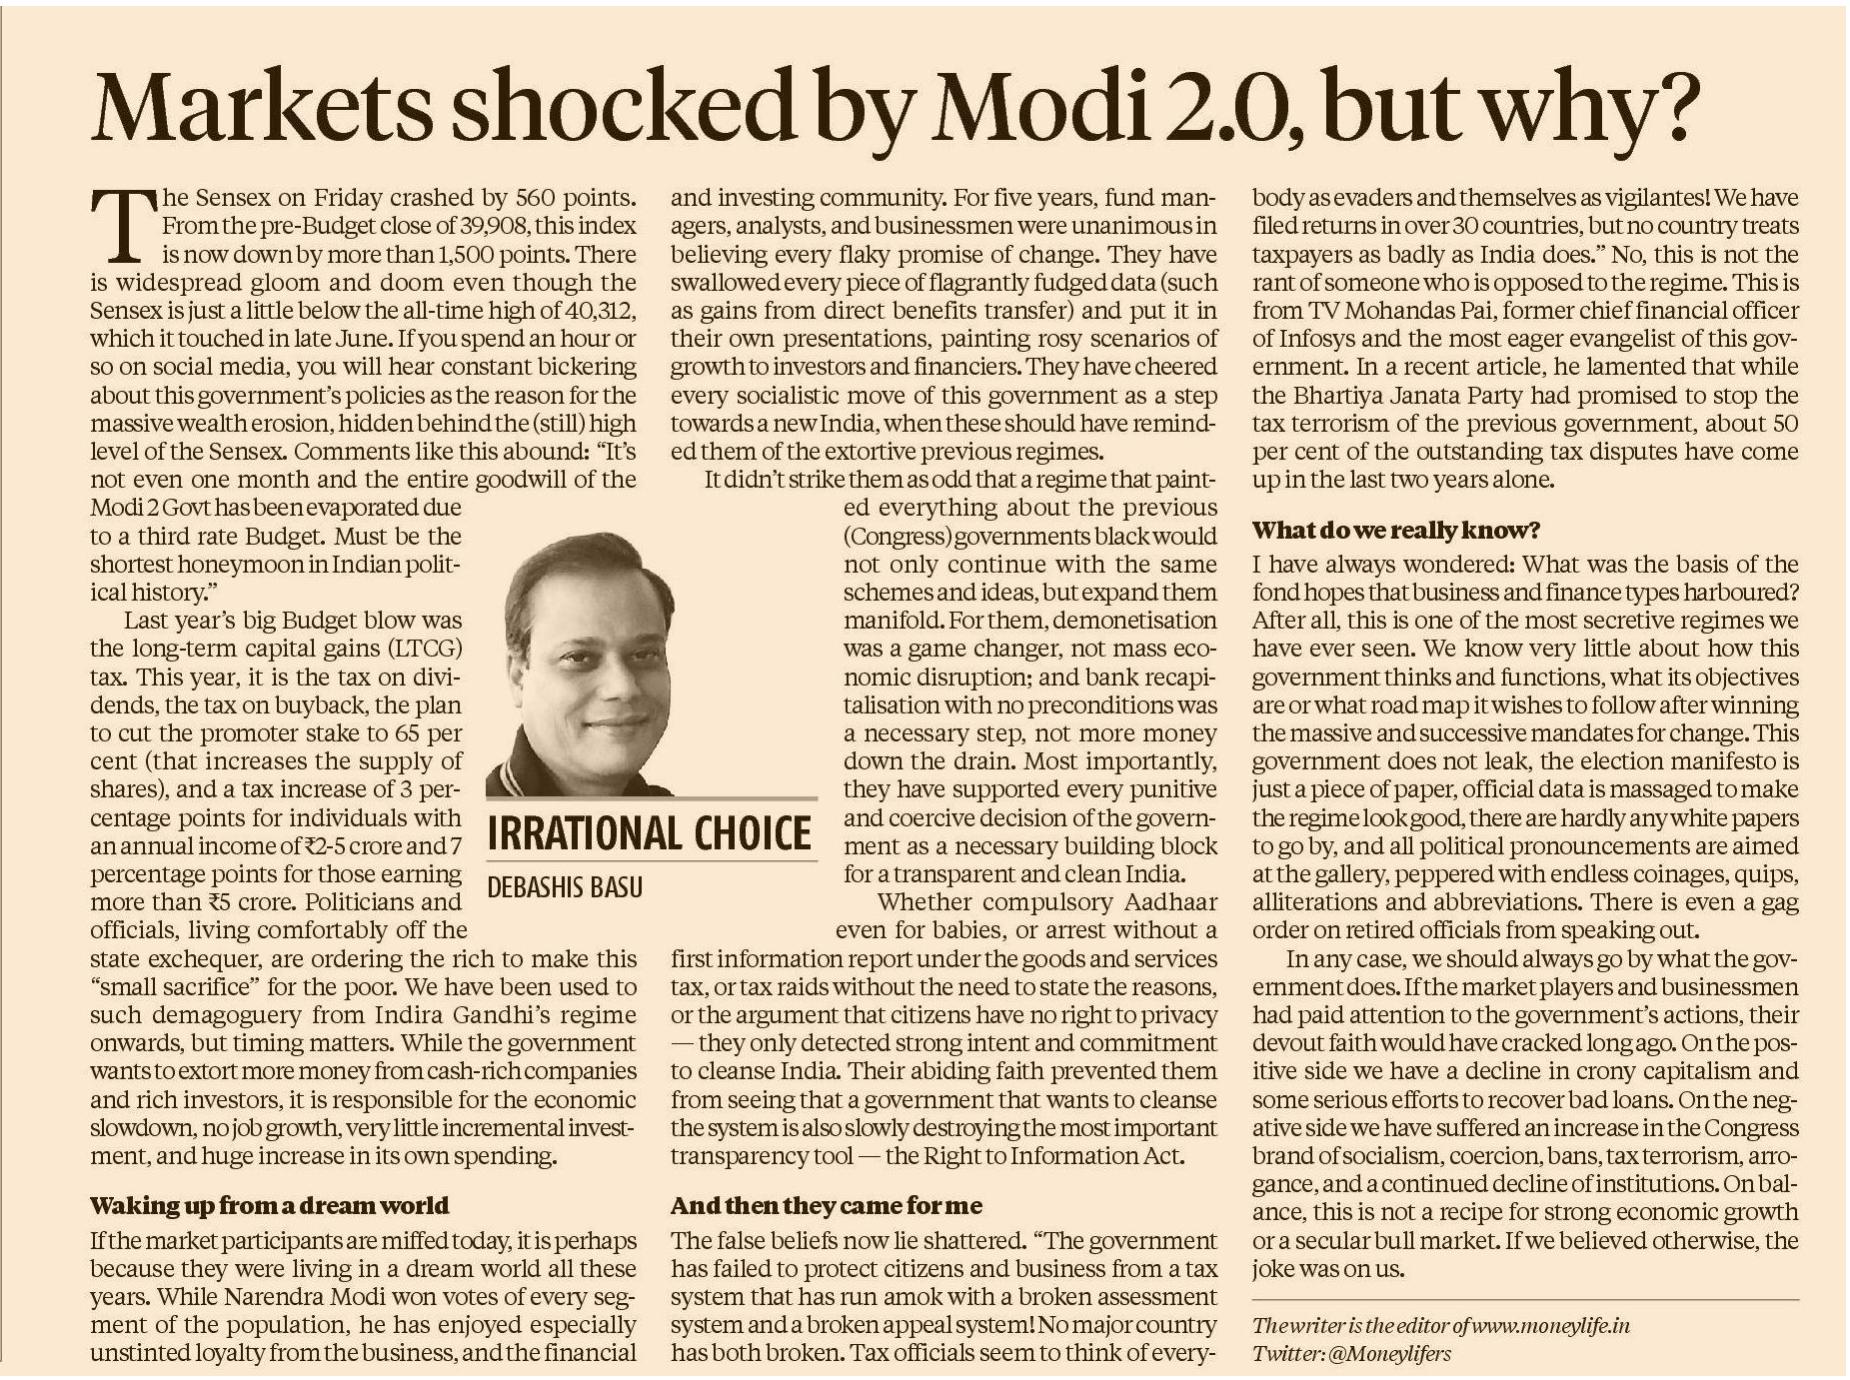
Markets Shocked by Modi 2.0, but why?

Brilliant piece by Debashis Basu on the current state of policy making in India. I would just add my two cents over here…… when the Liquidity is ample , you can experiment with policies and making abrupt changes with little damage to the system. But, when the LIQUIDITY is turning away, every policy change which constrains the money flow just makes it difficult to revive the system.

Image

Top 1000 World Banks – Indian lenders dominate NPL and worst profits lists

The Banker writes….

Indian banks once again feature prominently in the NPL table. In the 2019 ranking 11 lenders from the country feature, up from the nine that were present in the 2018 edition. This is a testament to the difficulties facing the Indian banking sector as it attempts to address pressing asset quality issues that stem from a credit boom experienced between 2006 and 2011. The highest placed Indian lender in the 2019 NPL ranking is IDBI, in position nine, with NPLs to total loans of 27.4%. It is followed by UCO Bank in 11th with NPLs of 25%. The remaining Indian banks occupy positions 15 and 17, while also rounding out the table from places 19 to 25.

Looking to the worst profit performance, Indian lenders once again feature heavily. IDBI tops the table with a loss of $3.28bn. In second position is Germany’s Norddeutsche Landesbank. The remaining banks, from positions three to 10, with the exception of Portugal’s Novo Banco in ninth place, also hail from India. The country’s public sector banks, in particular, have seen their profitability hit in recent times as they have been forced to onboard loan loss provisions.

https://www.thebanker.com/Top-1000-World-Banks/Top-1000-World-Banks-Indian-lenders-dominate-NPL-and-worst-profits-lists

David Hunter Interview- Gold at $1550 silver at $26 and oil at $10

This is a must listen interview. We are on the verge of first FED rate cut in a decade and any new start of a FED cycle , cut or hike , brings a regime change.

I think we are almost at the door of exploding volatility across asset classes and it might be prudent to keep open mind and adapt to the changes which are coming