The Relationship Between Yellow Vests and Electric Vehicles

Geohring & Rozencwajg writes “There has never been an instance in the history of civilization where a new technology with inferior “energetics” has replaced an older technology with superior “energetics.”

While in southern France last year, my wife and I had multiple contacts with the “yellow vests” as we drove from the Spanish border to Perpignan and Carcassonne. We experienced first-hand the agitation generated by the French government’s decision to raise the tax on diesel fuel. At many of the motorway’s toll booths, the “yellow vests” had broken the toll barriers and blockaded the use of both entrance and exit ramps. As we tried to move through the broken toll barriers, we were forced by mobs that many times exceeded 50 demonstrators to pay bribes to both enter and exit from the motorways. Although the ensuing “yellow-vest” riots in Paris garnered significant media attention, we at Goehring & Rozencwajg are fascinated by the media’s contortions to avoid discussing the underlying reasons for the uprisings.

In past letters, we have laid out two possible scenarios for the widespread adoption of electric vehicles: either the governments would heavily subsidize EV purchases (as Norway does today) or tax (or outright outlaw) the purchase and use of internal combustions engines (ICEs). Our Q1 2018 letter discussed how unfavorably the “energetics” of the EV compare to those of the internal combustion engine. Because of an EV’s inferior energetics, it costs more to purchase and run an EV than an ICE passenger car—a situation we believe will continue even with anticipated advances in battery technology. We also pointed out that there has never been an instance in the history of civilization where a new technology with inferior “energetics” has replaced an older technology with superior “energetics.” As an example, we like to bring up the plight of the Concorde supersonic transport jet.

Developed for billions of dollars in the late 1960s by a consortium of European governments, the Concorde was a technological marvel that cut the flying time between Europe and the United States in half. The plane became a favorite of the Hollywood elite, rock stars, and investment bankers, but after 27 years of being heavily subsidized by British Airways and Air France, the Concorde disappeared. Why? The answer is simple: the Concorde tried to replace an older technology (in this case the subsonic jet) with a new technology with vastly inferior “energetics.” Although the Concorde cut flying time in half, it required 900 liters of fuel per passenger to fly between London and New York. The Boeing 747, flying the same route, required only 250 liters of fuel per passenger. Even with the benefit of a quicker flight, the inferior “energetics” of the Concorde raised the cost far above what the average transatlantic passenger could bear.

Although not completely comparable, we believe we are in a similar situation today with the EVs versus ICEs. On a strict purchase and operating cost basis, the average consumer would never buy an EV. But in one way, the Concorde and EV look the same. Buyers of EVs at present (using Teslas here in the US, for example) are rock stars, Hollywood elites, and investment bankers. Although it’s still early in the EV evolution, seeing Tesla buyers who look just like former Concorde users is something our study of “energetics” would strongly suggest would happen.

So now, unsurprisingly, a major problem has emerged in the French government’s push to force out and possibly outlaw the internal combustion engine. Huge segments of the population are starting to rebel as the true cost of EV ownership becomes more transparent. The cost to switch to EVs can be absorbed by rich people, but what of the cost to the average French citizen? We have repeatedly told our investors that the switch to electric vehicles could be potentially extremely painful. At some point, the true cost and resulting pain will become apparent. The working-class people of France are now beginning to feel and rebel against these costs, even though the introduction of high cost EVs into France hasn’t even started in earnest.

Next week, we will continue along this theme and discuss how the “yellow vests” and similar movements may result in heightened scrutiny on EVs and the true costs of undertaking these ventures. Further, we will examine how this could have a material impact on future oil demand growth.

This blog contains excerpts of our in-depth commentary “OIL BULL MARKETS PAST & PRESENT, AND YELLOW JACKETS”.  If you are interested in this subject, then you may
download the full commentary here   

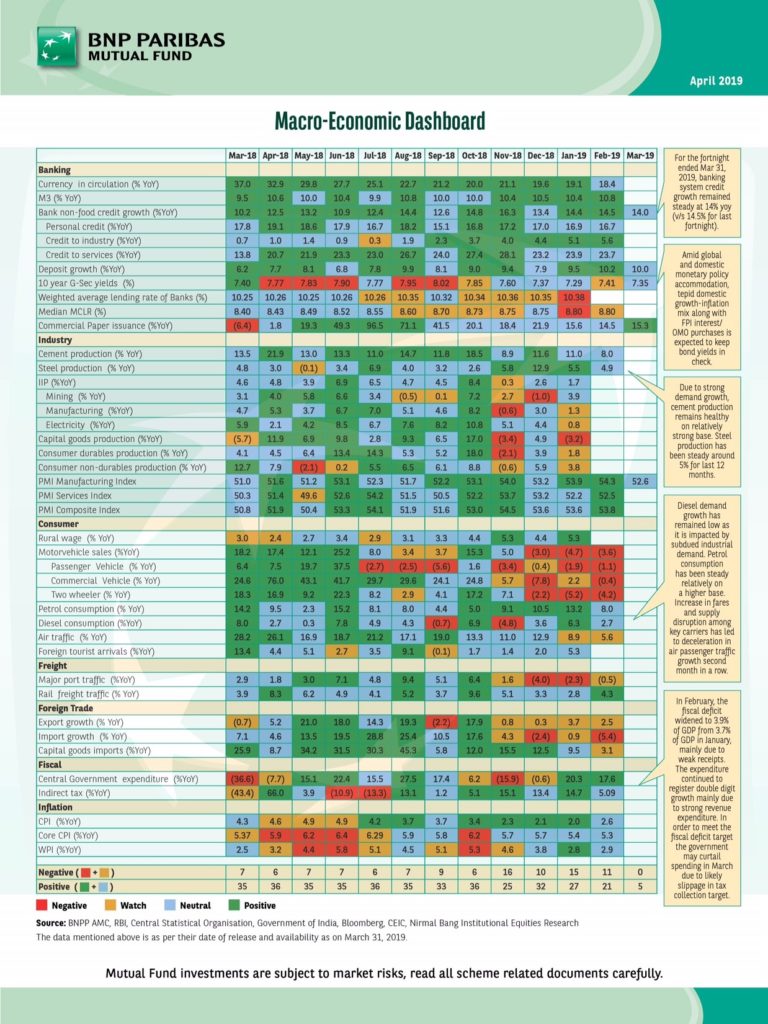
Macro Economic Dashboard-India

Key highlights of the fortnight:

·  For the fortnight ended Mar 31, 2019, banking system credit growth remained steady at 14% yoy (v/s 14.5% for last fortnight). 

·   Amid global and domestic monetary policy accommodation, tepid domestic growth-inflation mix along with FPI interest/OMO purchases is expected to keep bond yields in check.

· Due to strong demand growth, cement production remains healthy on relatively strong base. Steel production has been steady around 5% for last 12 months.

·  Diesel demand growth has remained low as it is impacted by subdued industrial demand. Petrol consumption has been steady relatively on a higher base. Increase in fares and supply disruption among key carriers has led to deceleration in air passenger traffic growth second month in a row.   . . In February, the fiscal deficit widened to 3.9% of GDP from 3.7% of GDP in January, mainly due to weak receipts. The expenditure continued to register double digit growth mainly due to strong revenue expenditure. In order to meet the fiscal deficit target the government may curtail spending in March due to likely slippage in tax collection targets

Charts That Matter-5th April

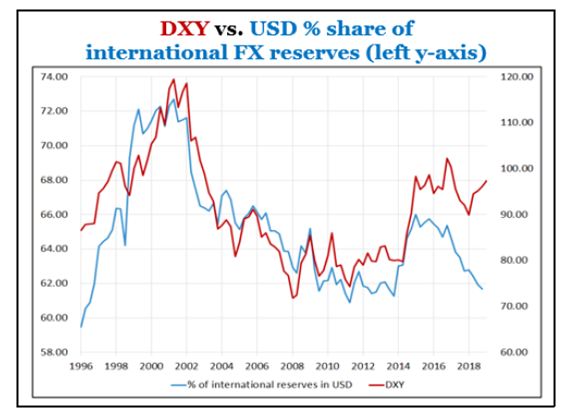
DXY leads the increase in reserve and not the other way round. If you are able to decipher Dollar movement over next couple of years …. you can know the fate of any market in the world

This image has an empty alt attribute; its file name is US-Reserves.jpg

The US financial conditions index is at a new low The Fed is creating a new and bigger asset bubble … Pay attention to Bitcoin in recent days … and the Fed might get bullied into lowering interest rates

Germany’s ongoing preference to rely on other countries stimulus rather than rely on its own economy for demand is a mystery … Germany, has become too reliant on exports, sort of like China back in 2007

US imports showing no sign of pick even in late March.

US$ rallies as central bankers sell Dollar

Martin Armstrong explains that the situation with USD is almost exactly the same as it was in 1927….He writes
The Fed lowered the rates in 1927. Then as the capital inflow really intensified and began pouring into the USA because of European politics, the Fed nearly doubled the interest rates into 1929 without succeeding in preventing the stock market rally. The Fed will most likely make the same mistake once again following Keynesianism. Expect them to chase the stock market raising rates and ignoring the rest of the world because the Democrats will blame the low rates of the Fed as benefiting the rich.

Read Full article below

https://www.armstrongeconomics.com/markets-by-sector/foreign-exchange/usd/us-rallies-as-central-banks-sell-dollars/

Best Puppet Show Ever

361 Capital Market Commentary | April 1, 2019

Bond investors liked it. Stock investors loved it. The President and White House pulled the strings perfectly so that it appeared that the Federal Reserve Board members were not acting out of their own accord. The magnificent performance began at the end of December and after a few missteps and crossed strings, the show ran perfectly. First, the Fed puppets conveyed that they would stop shrinking the balance sheet and then that they would stop raising the Fed Funds rate. Some even suggested that rate cuts were behind the curtain. Investors clapped and cheered like little kids at a Punch and Judy show and the financial markets roared to their best first quarter in years.

So what did we learn the last four months?
Rule #1: Don’t fight the Fed.
Rule #2: The POTUS wants to be re-elected.
Rule #3: This Fed is completely controlled by the POTUS.

Bottom line is that the Fed is being HEAVILY pressured to cut interest rates over the next two years. And if they don’t do it then their TV talking head replacements will do it for them. As short-term rates are cut, the economy will get more pumped, scaring longer term fixed income investors which should then steepen the yield curve. Even though the curve just inverted last month, that is probably the last we will see of it unless credit breaks. Economic data should start to improve through the summer, unless the trade wars and a closed Mexican border impede global commerce. The equity markets are trying to tell you that the economy is going to get better. The Treasury bond markets disagree, but the Credit markets choose the side of equities.

I didn’t foresee the White House calling all the shots at the Fed. I thought in November that an independent Fed would remain on track to build up reserves for the next credit crisis. When the Govt shutdown stopped the economy and the markets fell apart in December, I thought that it was prudent to be overly cautious. So the quick caving of the Fed in December caught me flat footed and under-invested in U.S. equities in the first quarter. I applaud any investor who was positive in both December and in the Q1.

From here, you have to have some risk on the books. I want my tallest stack of chips to be in the Emerging Markets which have a valuation advantage, a shot at more green shoots and a potential U.S./China trade deal. But with short-term rates falling and the curve steepening, you will have a tailwind to most equity sectors and geographies. Among U.S. sectors, plenty of great companies to own in the Technology and Consumer spaces. Be picky in Healthcare with all the moves and battles in Washington. And of course, I still want to own bonds, but maybe a bit shorter in maturity now. Also would stick to higher quality but still surprised by how well junk bonds have done. With inflation looking grim in Europe and now in the U.S., a big tailwind for Gold might be gone so I wouldn’t have many chips there. These are crazy times. This show has more twists than a Jordan Peele film so sit back and try to enjoy it

The White House absolutely owns the Fed right now…

https://361capital.com/weekly-briefing/best-puppet-show-ever/?utm_source=wrb&utm_medium=email&utm_campaign=04012019&utm_content=p

Charts That Matter-3rd April

One last time: The market is not the economy The economy is not the market Liquidity, artificial or otherwise, is the market. Sven Henrich

Caixin China March Services PMI 54.4; Est. 52.3 Highest reading since Jan. 2018 Employment falls to 50.2 vs 50.3 in Feb. the lowest reading since Sept. 2018 Prices fell No as robust as the headline number

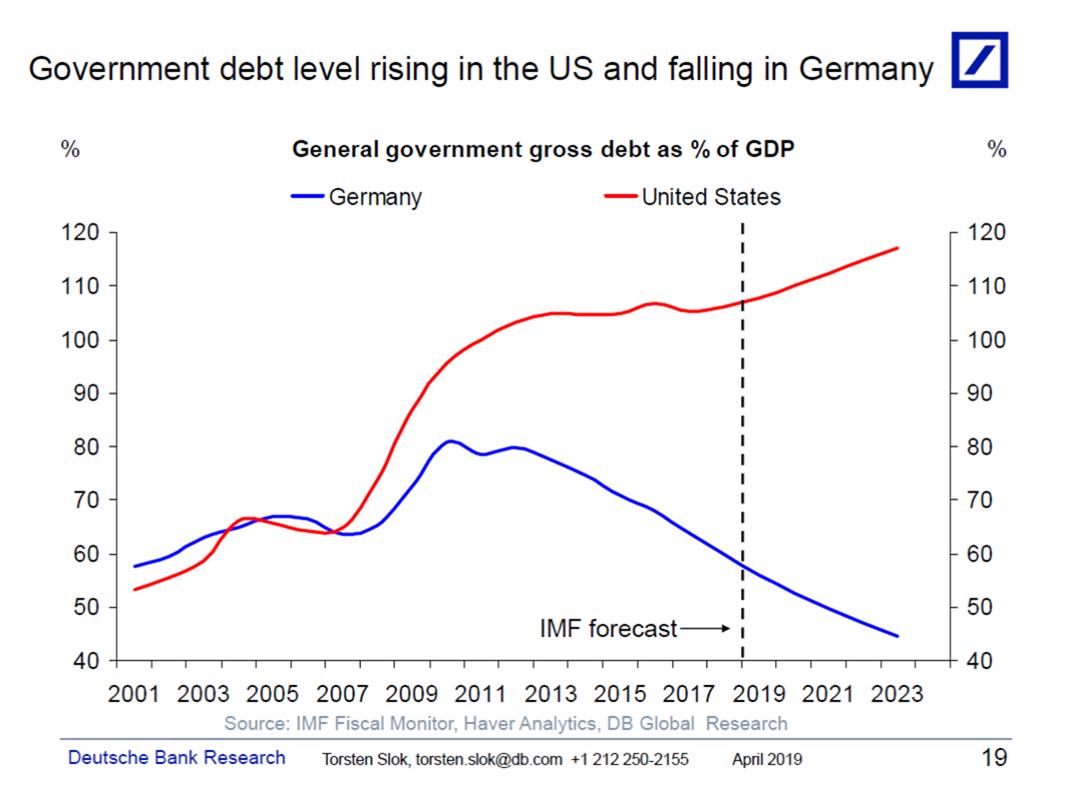
The two safest assets are (arguably) the German bund and the US 10-yr… However, the US debt is rising and the German debt is falling. German debt, however, may contain more risk due to the Eurozone contagion risk. High deficit or high Eurozone risk. Who wins?

This was the decade of de-leveraging that wasn’t. A decade ago, as the world began to piece the financial system back together after an epic credit crisis, there was agreement on one thing: Too much debt had caused the crisis, and so there must be a huge de-leveraging. It has not worked out like that.

click at the link below to compare debt in 2007 and 2018

https://www.bloomberg.com/graphics/2019-decade-of-debt/

Buyback Hangover

The end of Q1 is almost here and gears are shifting to blend into the buyback blackout period that awaits for us. A slowdown is lurking in ambush and investors who were once dancing in the sparkling highs of S&P500 are now having cold feet. Markets have become so accustomed to Buybacks that a blackout period pose a threat to equity markets in general.

2018 has seen the highest record share repurchases and have rallied 20 percent from its December lows. However, for many investors now is the dreaded time when earnings are announced and companies 5 weeks prior to the reporting and 48 hours after cannot be involved in discrete buyback program punching the demand, as a result of which about 40% of the S&P500 companies will be hit.

The amounts of BBB rated credits is at all time high and those companies are jumping out of the frying pan and into the inferno if they choose to reduce their capex and increase their buybacks which in next recession can seriously challenge their credit ratings

Salt meets wound. To add to this wound, the downward market correction would be incited by the new proposals by senators regarding restricted buyback activity in the corner. Pension fund rebalancing instigating quarter end selling is also nudging investors to go underweight in their positions.

Indian Corporates not interested in investments

Mahesh vyas writes in CMIE……

Financial statements of Indian companies show that they have been very reticent, in recent years, in investing in fixed assets and particularly so in investing in plant and machinery. In 2017-18, net fixed asset investments of non-finance companies grew by 7.9 per cent in nominal terms. At the same time, investments into plant and machinery grew by a significantly lower 6.8 per cent. These were the lowest growth rates since 2004-05, i.e. in 13 years.

These growth rates were earlier estimated to be a bit higher at 8.4 per cent and 10 per cent. However, the latest estimates based on a larger sample of companies (8,544) shows that the growth rates in 2017-18 were substantially lower than estimated earlier. As the sample size increases further, the growth rates could decline a little more because companies that enter the sample late are usually also the ones whose performance is less-than the average.

While companies have reduced the growth in investments into fixed assets, they have awarded share holders increasingly higher dividends. Simultaneously, the share of profits retained in the company for possible future investments has also reduced substantially in recent years.

Put together, the above set of data indicates that corporate India has been giving investments into new capacities a thumbs down in recent years. Further, the data shows that this restraint of corporate India towards investments has been pronounced since 2014-15.

In 2017-18, 64.4 per cent of the net profit of non-finance companies was distributed as dividends. This is close to the average of 65 per cent recorded in the past four years – since 2014-15.

The average payout ratio in the four years before 2014-15, i.e. from 2010-11 through 2013-14 was much lower at 45 per cent. It was even lower between 2006-07 and 2009-10, at 26 per cent. The dividend payout ratio has been rising steadily since 2007-08 when it was at its historic low of 22 per cent. However, while the payout ratio never crossed 60 per cent till 2003-14, it has been consistently above 60 per cent since 2014-15. In fact, it peaked at nearly 71 per cent in 2015-16.

Companies have reduced the proportion of profits retained back for possible future investments. In 2017-18, about 25 per cent of net profits were retained.

The average share of retained profits in net profits in the four years till 2017-18 was 23 per cent. This compares very poorly with retained profits accounting for 47 per cent of net profits in the preceding four years.

Evidently, companies have not only shied away from investments in new capacities they have also left behind much less for future investments. Instead they have awarded shareholders with a larger-than-ever share of profits in the past four years.

Dividend payout is mostly insulated from a shrinking of profits. Net profits of non-finance companies have shrunk in nine of the 28 years since 1990-91. But dividends have shrunk only twice – once in 2008-09 and then in the latest year – 2017-18. Aggregate dividends shrunk 6.7 per cent in 2008-09 and by a negligible 0.2 per cent in 2017-18.

Dividends received by an investor was exempted from taxes for a very long time – from 1996-97. This changed in 2016-17 when dividend income in excess of Rs.1 million was taxed 10 per cent in the hands of investors. This could explain partly, the fall in the payout ratio from the peak of 71 per cent in 2015-16 to 61 per cent in 2016-17 and 64 per cent in 2017-18.

However, the 61-64 per cent payout ratio in spite of taxation of dividends – both at the company level and at the level of investors besides the taxation of profits at the company level indicates that investors are quite intent on taking out profits from companies and leaving little behind.

Companies have been drawing out dividends and not retaining profits in spite of the steady increase in cost of borrowing. At close to 9 per cent on an average, interest incidence in the past four years has been the highest compared to the past 15 years. This should have motivated companies to retain profits for investments rather than borrow. But, companies have been taking out profits in larger proportions.

Contrary to popular perception, the balance sheets of non-finance companies are not stressed to stop them from borrowing. The debt to equity ratio in 2017-18 was at a record low of 0.84 times. Corporate India has never seen such a low gearing ratio ever in the past. But, borrowings growth at 4 per cent in 2017-18 was at a 13-year low.

If the high cost of borrowing holds them back then they should have retained the profits. But, if they neither borrow nor retain profits, then one inference of their behavior is that they do not find sufficient need to invest at the moment. This is corroborated by the very low asset utilisation ratio that non-finance companies face. At 0.68 times in 2017-18, the total income to total assets ratio was the lowest in the history of Corporate India. Never in the past has Corporate India been able to extract so little from its assets.

Tragedies of the educated unemployed

Mahesh Vyas writes…

The unemployment rate among those who had completed graduation or higher education (graduate+) has been rising steadily since mid-2017. During September-December 2018, the unemployment rate among these had reached 13.2 per cent. A year ago, the unemployment rate in this group was 12.1 per cent.

Graduate+ face the highest unemployment rate among groups of individuals organised by the level of education achieved. It is usually twice the average unemployment rate for the entire labour force. It is worse for graduate+ women.

Read Full article below

https://www.cmie.com/kommon/bin/sr.php?kall=warticle&dt=2019-03-19%2009:46:12&msec=486

Charts That Matter-1st April

There’s been a significant divergence between inflation expectations and oil prices recently. This suggests that either the oil rally has gotten ahead of itself or worries about global growth are a bit overdone. h/t @LaMa2anee

Global manufacturing PMI for March matched Feb reading but when India and Mexico (which were too late this month to be included) are added, it likely slipped again for the 11th month in a row—matching the longest stretch of weakness seen in 2008.

Historically, reversals in the long-term relative performance of growth and value stocks, large and small cap stocks, and U.S. and international stocks have been marked by yield curve inversions. Read more => https://www.schwab.com/resource-center/insights/content/inversions-and-reversals-leaders-and-laggards-may-be-changing-places …

US real yields (measured by 10y TIPS) have collapsed to 0.59%, suggesting way lower US GDP growth.