https://drive.google.com/drive/mobile/folders/1osFvHLABRMk8D6xUxpTIWAdjMpyprwqu
TECHNICAL ANALYSIS: OUTLOOK FOR 2019 – MARKETS LOOKING FOR LIQUIDITY
Mehul Daya and Neels Heyneke are out with a fantastic technical report on global markets……..they write,Last year, global dollar liquidity contracted, and the dollar and emerging markets reacted to this contraction. This year will determine whether the tighter global financial conditions will continue to work their way into the bond and equity markets or if central banks will come to their rescue. A lot of research effort is spent on future Fed policy, but we believe the Chinese monetary system is the weakest link right now and that it needs to be monitored closely.
• We have been warning since early last year that deflationary, and not inflationary, forces remain the bigger headache.
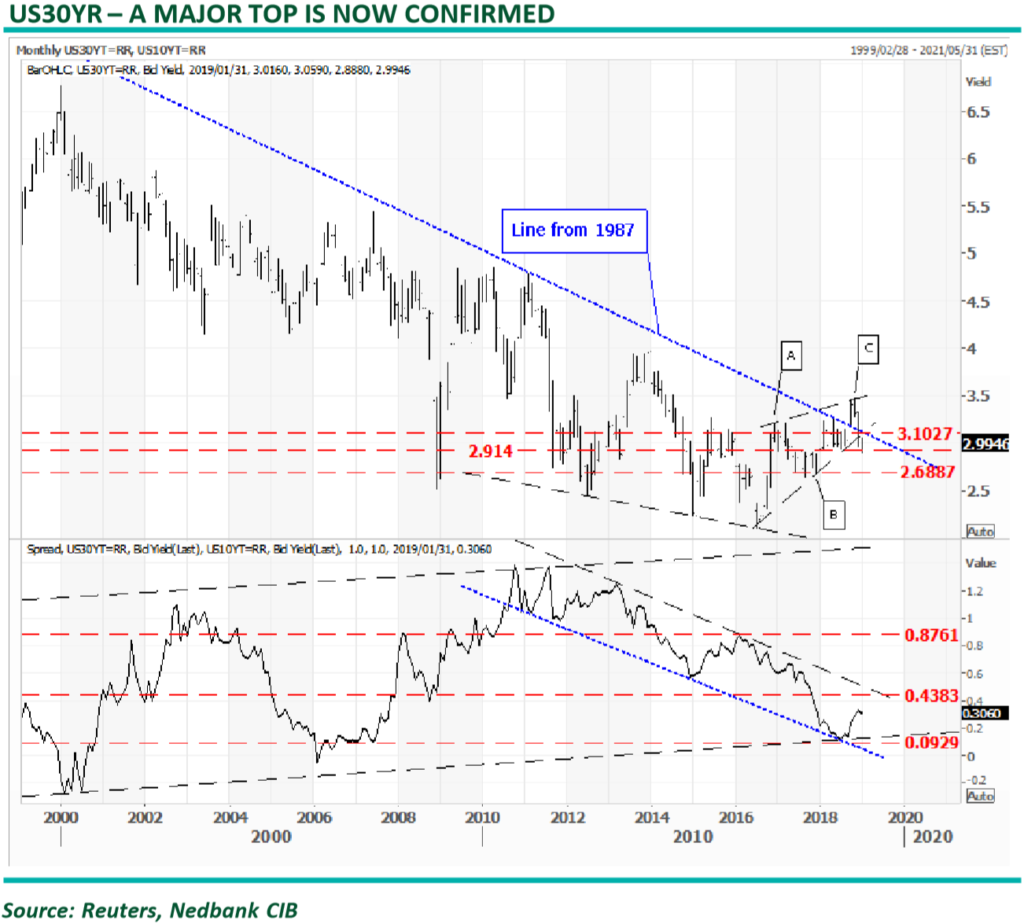
• The fact that the break out of the bull trend since 1987 has proved to be false on the US government 30-yr is a buy signal in itself. The break below 3.10% projects a move to 2.68%, with more downside potential after that.
• The 30-10yr spread remains in the bull trend that started in 2012 as QE programmes compressed term premia and volatility. A break above 43 basis points will indicate the markets are starting to price risk into the curve, which will not be good news for risk assets.
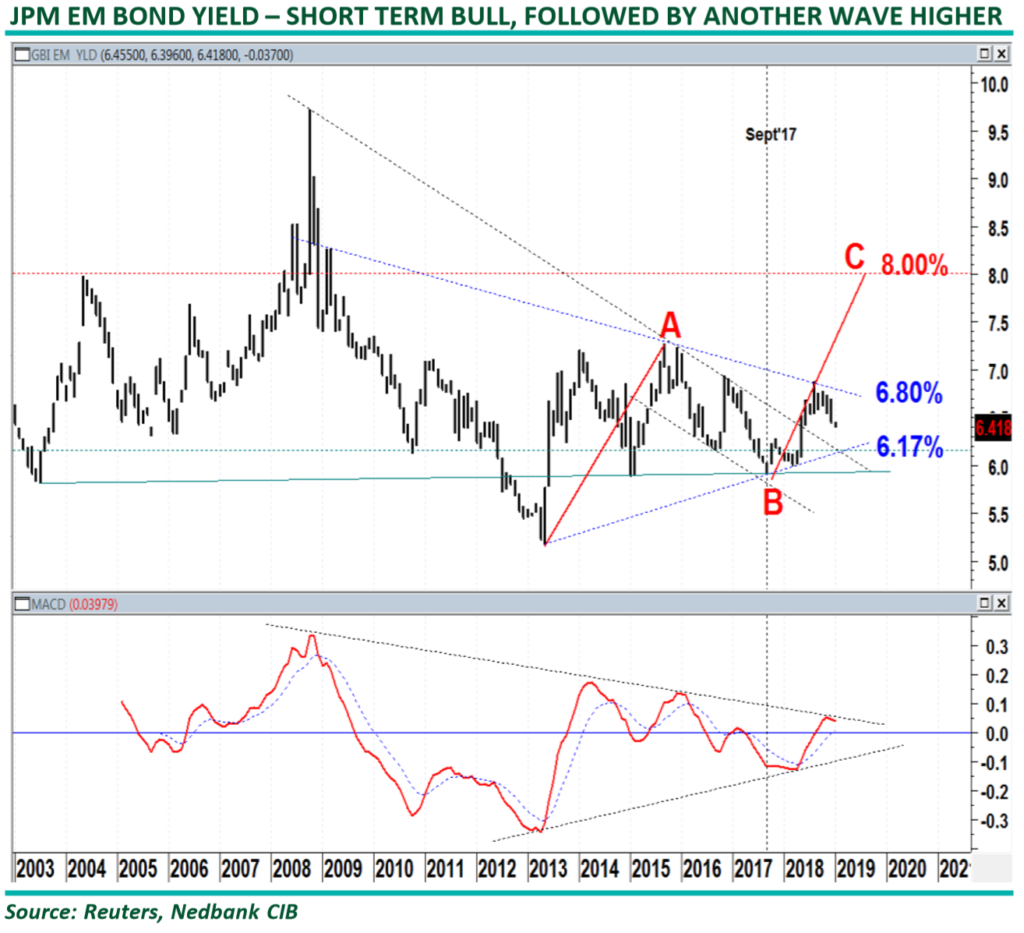
The JPM emerging market bond yield bottomed with the “Taper” statement in 2013. Yields peaked in early 2016 with the “Shanghai accord” and bottomed out in September 2017. This was several months before the risk-off started in other asset classes – in late January 2018, with the VIX sell-off. • Wave A was in the region of 2%, and in theory, wave C should also be 2%, targeting 8%.
• We believe the fundamental driver of this move will be the Chinese economy and, subsequently, a further contraction in global dollar liquidity. • We have had the view, since early last year, that a repeat of the 1998 SE-Asia is a likely outcome. This time, China will be the victim of the impossible Trilemma, which states that it is impossible to have all three of the following at the same time: a fixed foreign exchange rate, free capital movement and an independent monetary policy.
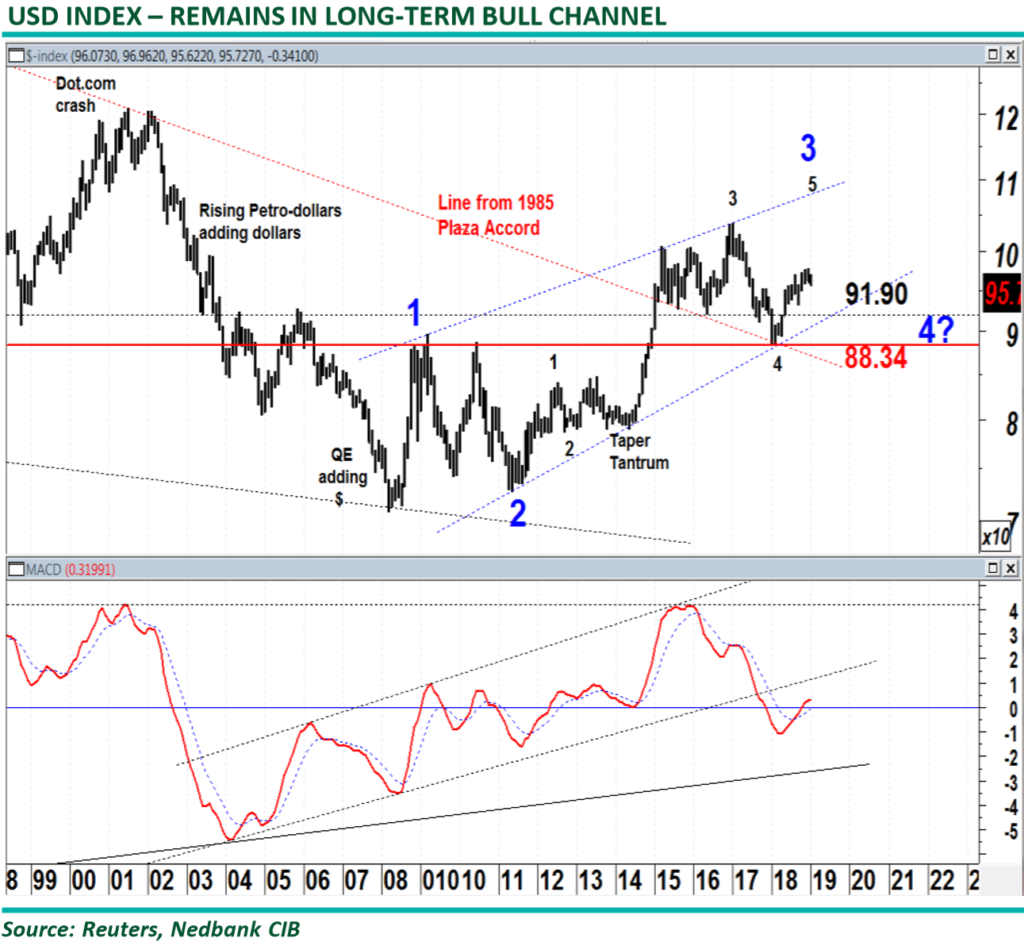
The dollar has been in a bull market since the GFC and rallied in early 2018 from the important support line from 1985 at 88.34. • We have written extensively over the last few years that interest rate differentials alone are not the only drivers of currencies anymore. The quantum of dollars in the system, stemming from Fed policy, developments in the euro-dollar system, global growth (velocity of money) and shadow banking activities need to be taken into consideration. • The dollar bull lost momentum during 4Q18, and a correction is playing out. The target levels for this correction are 93.09 and the neckline and support line at 91.90. • Only a break below the latter level, out of the bull trend since 2010, will force us to revisit our long-term bullish view on the dollar.
The performance of the US markets helped the MSCI World Index to remain above the resistance line through the highs since 2000. The break was, however, not sustainable, and the break back below the resistance and below the support line from 2009 is a bearish signal. At this point, the correction from the 1Q18 is still an ABC pattern, which indicates a correction phase. Any further downside move below 1,809 will, however, confirm that the market is trending to the downside, targeting the wave 4 low at 1,466. • The Shanghai Accord, however, managed to stop a bear trend from unfolding. There are many views that the central banks must reverse their tightening biases. That is surely possible, but we are sceptical about whether a new Shanghai Accord can be reached, as the global geopolitical landscape is quite different today vs that in 2016. • In a geared world of shadow banking and asset inflation, bear markets do not always start with the economy slowing down. In 1998, 2000 and in 2008, tighter financial conditions derailed markets, triggering an economic slowdown. The reason being, as asset prices fall, the re-hypothecation process slows down, triggering a major liquidity squeeze that works its way back into the real economy.
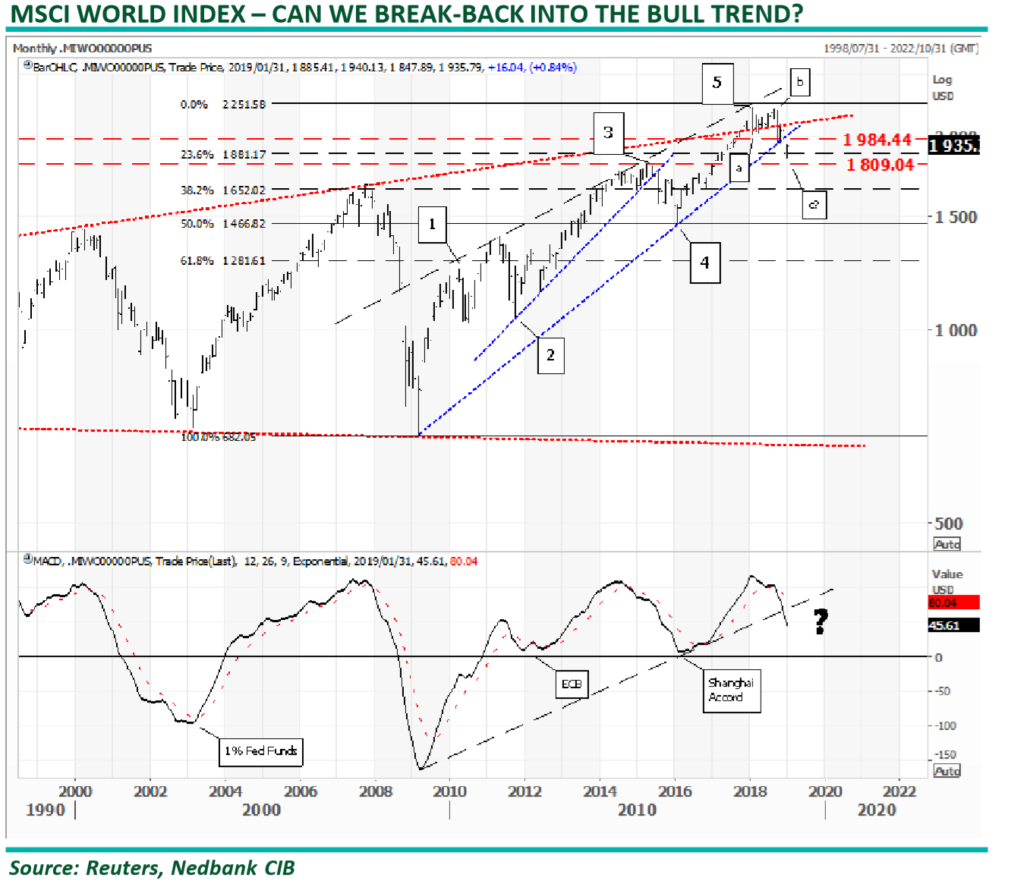
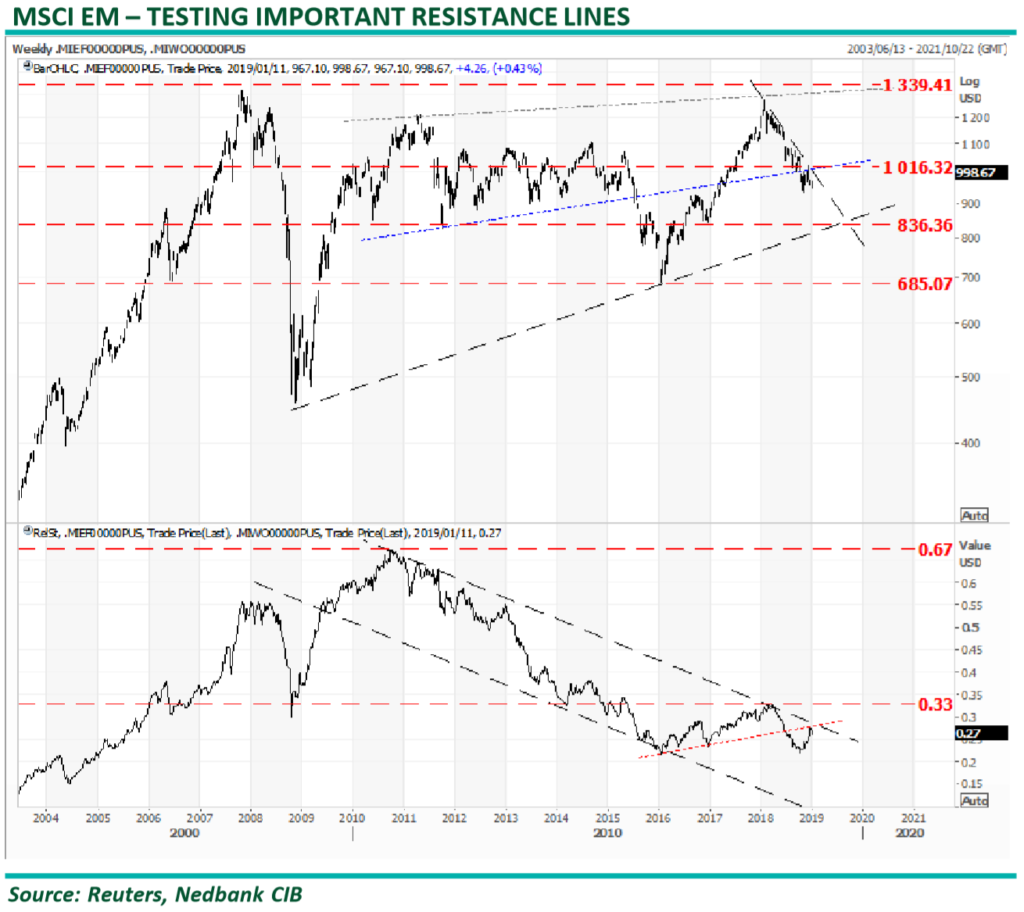
The MSCI EM has been in a bear market since the start of 2018. The EM equities bottomed out, along with the EM currencies, during 4Q18. However, EM equity markets failed to rally, as the US equity markets came under pressure. • The EM index is currently trading against an important resistance line at 1,016. It is crucial for the bull story that the EMs must accelerate through this resistance in the near future. • If the index fails at current levels, it would project further downside to the support line and previous low at 836. The JSE Top-40, in USD terms, is already consolidating against an equivalent support line to the 836line. • The bottom panel is the relative of EM over DM equities performance. The relative rallied within this well established bear channel during the riskon phase of 2016 and 2017 but turned down sharply during 2018. We believe the latest rally will turn out to be a goodbye kiss against the red neckline and expect the relative to turn down from current levels.
Charts That Matter- 17th Jan
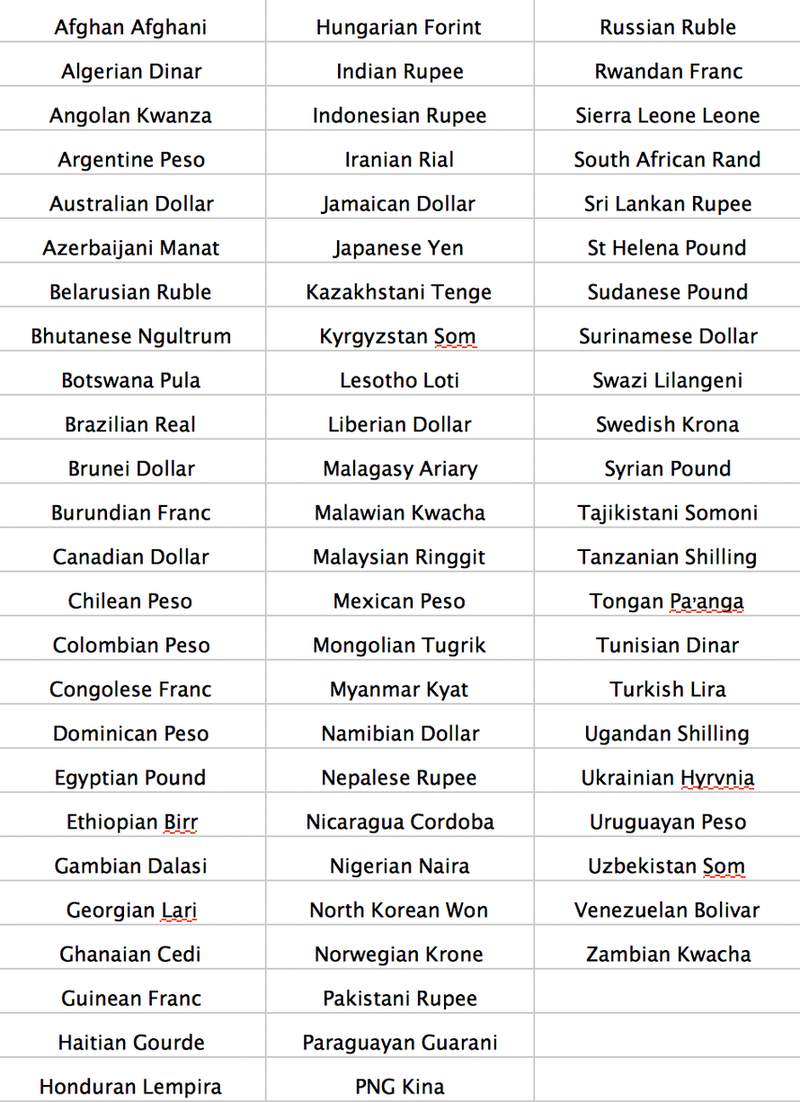
Popular belief has it that gold prices have not performed especially well despite some egregious geopolitical and economic factors. Well measured in 72 currencies, gold is at … or within a few percentage points … of being at an all time high for people in those countries. Not on the list are the British Pound, the Swiss Franc, the Euro and Chinese Yuan – but we are not far off in all of those currencies too. Only in USD does gold lag – and not all of us live in the US.
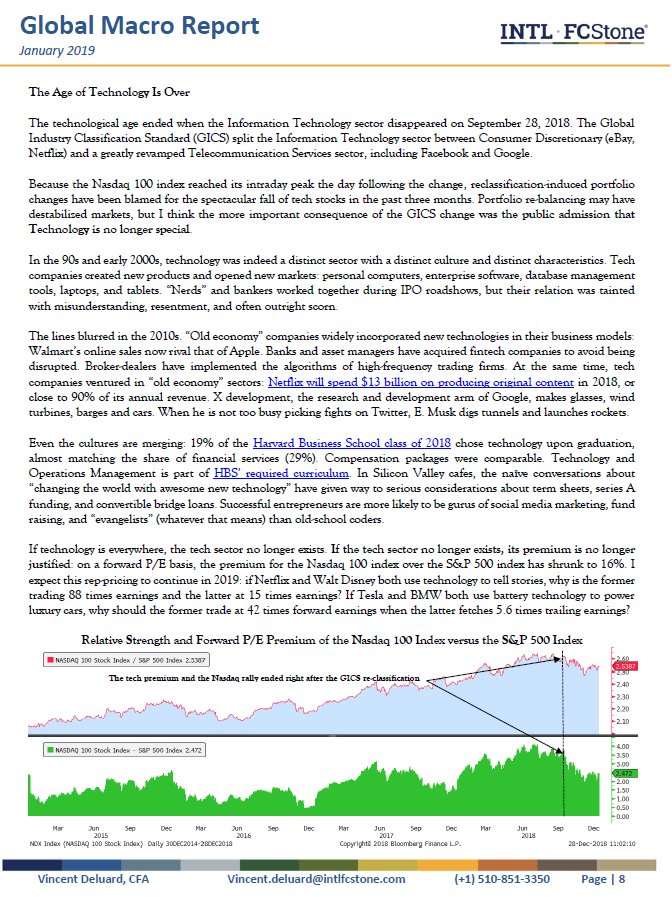
The age of Technology is over- Vincent Deluard
If technology is everywhere, the tech sector no longer exists. If the tech sector no longer exists, its premium is no longer justified: on a forward P/E basis, the premium for the Nasdaq 100 index over the S&P 500 index has shrunk to 16%. I expect this rep-pricing to continue in 2019: if Netflix and Walt Disney both use technology to tell stories, why is the former trading 88 times earnings and the latter at 15 times earnings? If Tesla and BMW both use battery technology to power luxury cars, why should the former trade at 42 times forward earnings when the latter fetches 5.6 times trailing earnings?
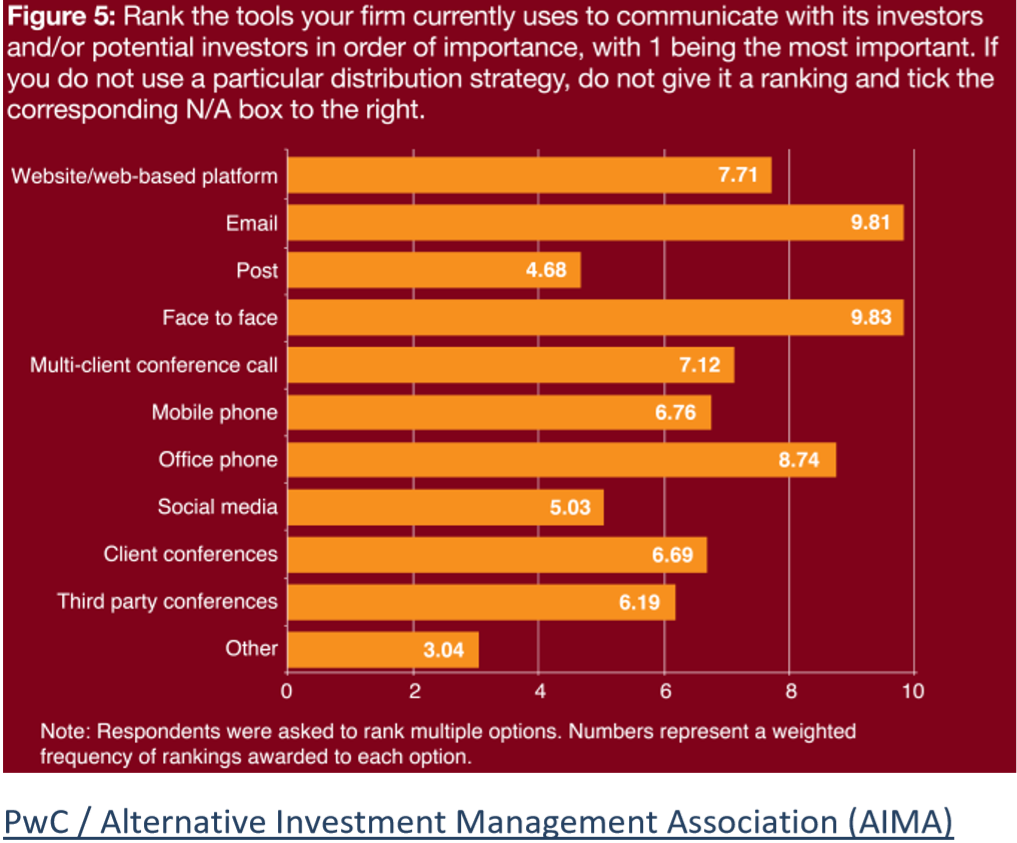
Face-to-face access still prized above all else
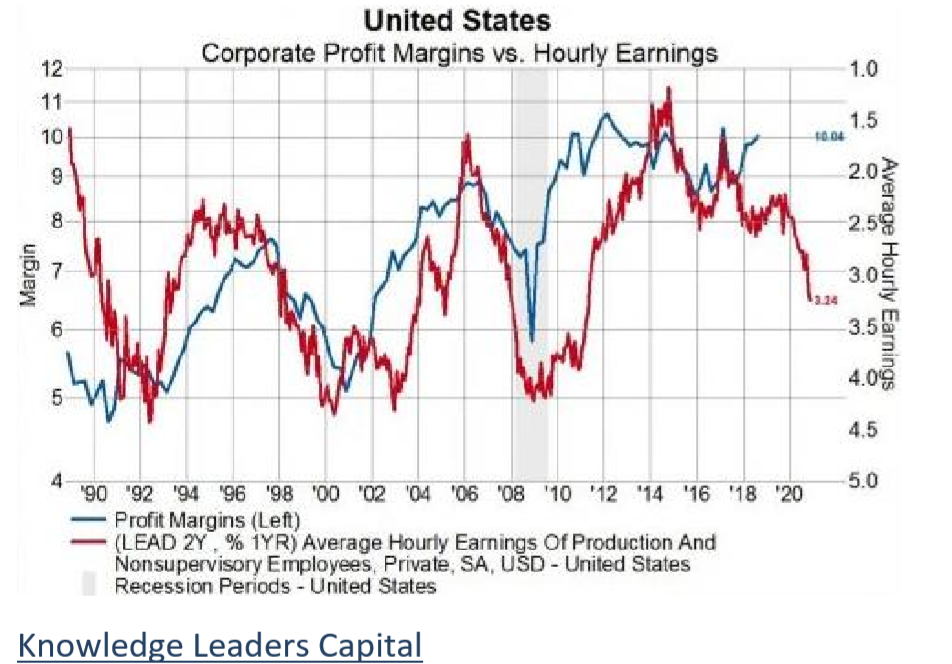
Is 2019 going to be the year of the profit margin problem?
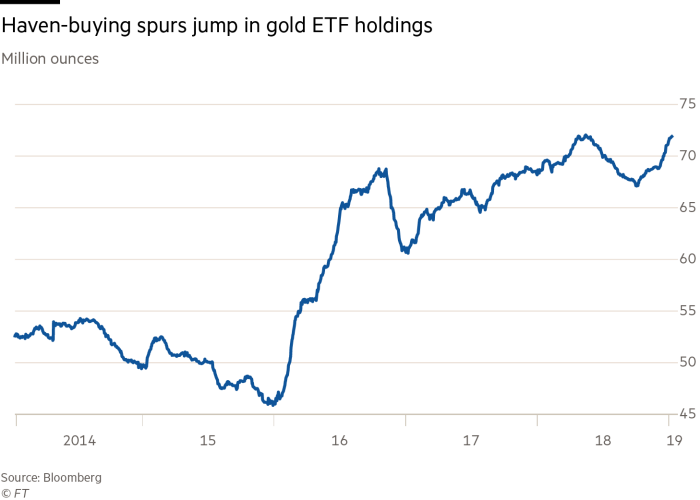
If we continue to see elevated levels of macroeconomic uncertainty and risk adversity, then gold will probably continue its positive momentum
The new economic Concentration
David writes…….If companies know they must create moats to attract investors, they will use political power to raise barriers to new entrants or acquire patent protections, building the walls ever higher. Failing that, they’ll just buy out the competition. Tepper notes that Google, Facebook, Amazon, Apple, and Microsoft have purchased 436 companies and startups in the past ten years, without a single regulatory challenge to any acquisition.
The effects of all this are profound. Tepper started the book to decipher the wage puzzle: Why did leading indicators keep pointing to higher wages that never came? He found that workers with fewer choices to deploy their talents—a condition known as monopsony—cannot bargain for better pay. As the benefits of economic growth pool in corporate boardrooms instead of workers’ pockets, inequality naturally follows.
Charts That Matter- 16th Jan
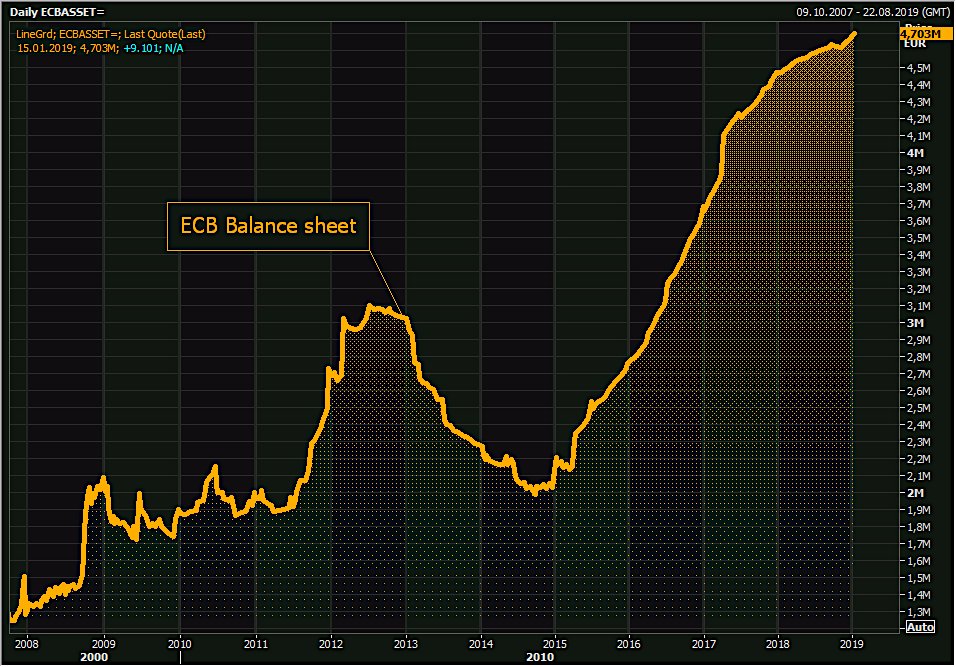
ECB Balance sheet hit fresh all time high at €4,703.4bn as QE reinvestments higher than redemptions. ECB balance sheet now equates to record 42% of Eurozone GDP while Fed’s balance sheet has shrank to 19.6% of US’ GDP.
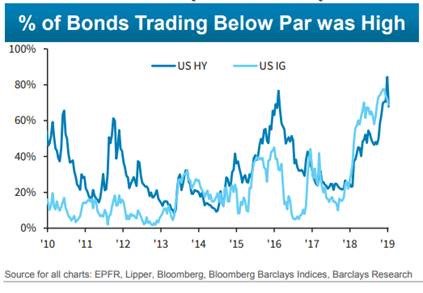
Higher yields + wider spreads in 2018 have left nearly 80% of corporate credit trading below par – highest % in the last decade.
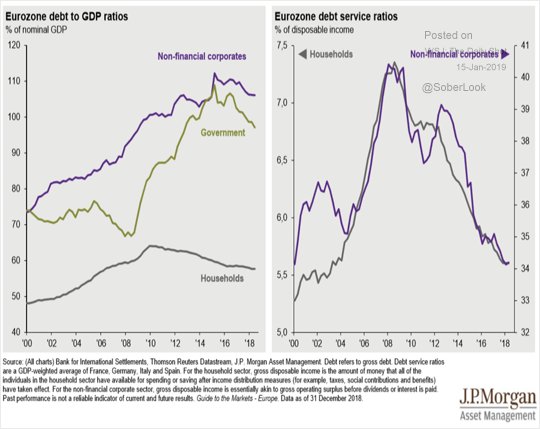
European debt
Utility companies are safe? Think again.
Bankruptcy Next, PG&E Says. Shares Down 90% in 15 Months. From “Investment Grade” to “Default” in Three Weeks

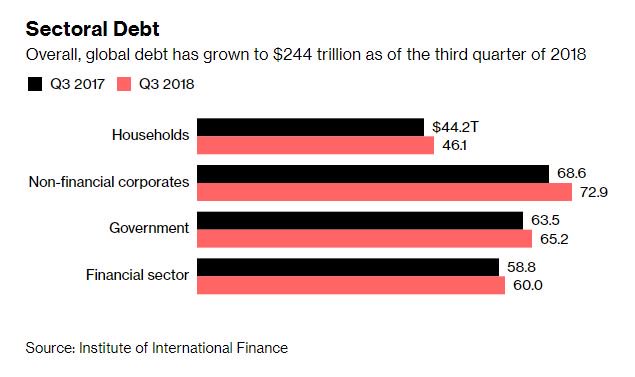
The world’s debt pile is hovering near a record at $244 trillion
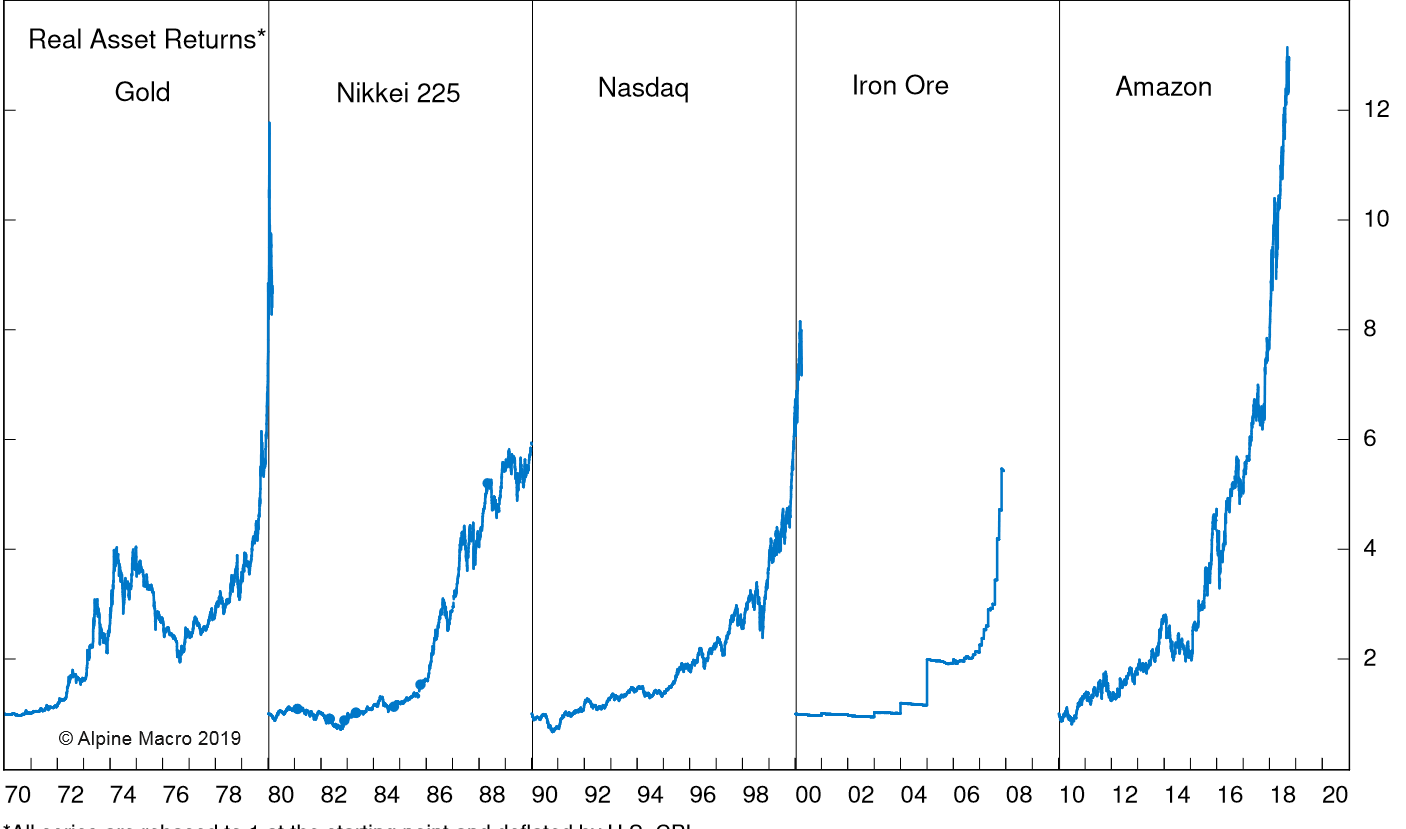
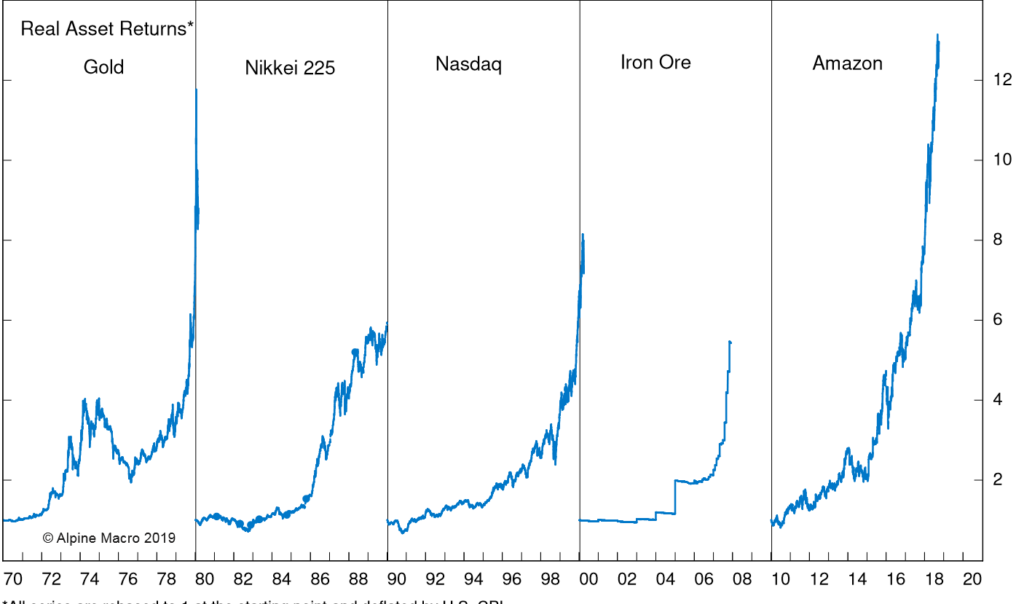
A new winner every decade- Alpine Macro
Signs of Monetary Restraint
Lacy Hunt writes… our current lower rate and inflation circumstances are due to lower velocity of money, higher debt, and poor demographics. Therefore, a larger percentage decline in inflation and interest rates can be expected. Even a mild recession in 2019 would put the Fed in an untenable situation.
It is conceivable that the Fed, constrained by the zero-bound interest rates and in attempting to raise economic activity, could engage in another untested experiment with unforeseen consequences to boost debt levels. If that occurs, the U.S. debt overhang would worsen and the country would follow a path pursued by other heavily indebted countries such as Japan, Europe and China. The risk is rising that the U.S. will not only return to zero short rates but, as they have in Japan, might remain there for several years.
The Three R’s: Relapse, Reflate And Rebound
Alpine Macro writes…Stepping into 2019, global financial markets are fraught with risk and uncertainty. The steep drop in global equity prices since October 2018, the sharp decline in oil prices and the strong rally in government bonds have seriously dented investor sentiment, creating a heightened sense of pessimism.
However, we believe that 2019 will play out differently from how it has begun, because policy reflation is on the way. Barring major policy mistakes by the Fed, the Trump administration or Chinese policy makers, risk assets should rally on policy reflation and, eventually, an improving global growth outlook.
Specifically, the losers of 2018 could be the winners under our scenario: They’ve been beaten down in anticipation of a growth relapse, will benefit from policy reflation and should subsequently rebound.
The “Big One”(vol event) hasn’t happened yet
Chris Cole explains in this must read interview…The first thing to understand is that volatility is not just the left tail. It’s not just the world ending. One of the highest periods of volatility in history was during the Weimar Republic in Germany when they went into their hyperinflation. Vol went up to 2000%, all on the right tail. So you can have periods where there is a massive amount of volatility with higher asset prices.
A great example of that in recent history was during the Nasdaq bubble in the late 2000s. Volatility was actually averaging higher than where it is today and the market was going up and up and up. You had a 100% increase in the stock market during a period of plus-20% or more volatility. That’s pretty amazing.
You can have right tail and left tail vol. You just need movement. You need change. Vol is the profiting from change.
It’s difficult to explain our entire suite of what we do, but I can give some glimpses of the philosophy behind it. One aspect is you can never predict what spark will cause a forest fire but you can predict the underlying conditions that lead to a higher probability of a forest fire.
An example of that is that if you’re looking to gauge whether or not a forest fire is going to start in California (and the forest service does do this), you look at things like buildup of dry chaparral, high wind conditions, dry weather conditions, lots of lightning strikes. These things, when put together incrementally, increase the probability of a fire breaking out.
On the same vein, we can scan thousands of cross-asset global macro conditions and use those to probabilistically build an expectation as to whether or not right- or left-tail volatility will be
realized in any given asset class. That produces an ability for us to dynamically size that exposure when the probability of a volatility wildfire is greatest. That’s one of the most effective ways that we can do it.
Another thing to do is to use vol arb techniques. There’s situations where you are paid to own volatility – usually you’re just buying into a vol spike when term structures are inverted – is an example of that type of opportunity where you’re actually paid to own that convexity exposure.
There’s other situations where – I think in one of my papers I talked about this – the George Lucas trade where, when Lucas was making a space opera, which we now know as Star Wars, the studio came to him and he was given about a million dollar salary. And he said, well, you know, I don’t want a million dollars. Give me $150 thousand, but I want to own the merchandising and sequel rights to my new property.
Of course, we all know how that turned out. That $850 thousand option that Lucas bought by giving up his carry turned into about $46 billion. Not a bad trade. George Lucas was a very smart options trader.
In some aspects, when you have an opportunity to own some linear carry, you can recycle that carry into very powerful convexity exposure on either tail. And that convexity exposure, it usually takes a big move for that convexity exposure to pay out. But that’s an example of when you can carry volatility in an efficient way.
So it’s a combination of these types of strategies that enables you to own the optionality on change without the significant negative bleed.
Can you do this yourself? Boy, it’s tough. I mean, I’ve got a whole team of PhD data scientists and experts – we even have an Olympic swimmer on staff – it takes an entire team scanning a lot of data and working very, very hard on this one specific task.
So, yeah, you know what? Will you lose money buying VIX futures? Yeah, of course. That’s not a very smart way to do it. That’s why it takes a lot of hard work and a lot of experts spending a lot of time and energy and effort and upfront money to be able to find smart ways to carry long-vol exposure
Holding ON
So what comes next? Well, earnings season of course. Stocks are still lower going into the big 3-4 weeks of earnings reports but at least they are only 10% lower instead of 20% lower. Maybe still a good setup for those companies who can still crush it at the top and bottom line and give great forward guidance. But are there many of those companies in this current environment? I don’t think so. We will read the reports, listen to the calls and look for any good tidbits to follow up on so that we could add those stocks to our watch lists. The Government shutdown looks like it will last a while longer. The weekend polls shifted toward a Trump/GOP blame, but the numbers also show that a smaller crowd still supporting Trump have become more emboldened about wanting their Wall. This would imply that the main players in this game of tug of war will only dig in deeper. And if the shutdown cannot be solved, don’t expect anything else to get done either in the White House or Congress during the Q1.
Charts That Matter-14th Jan
Political risks remain high in 2019 as critical elections could lead to policy turns or surprise outcomes: In EM, India, South Africa and Argentina are elections w/ highest stakes this year. In DM, Europe will be closely watched. Standard Chartered runs electoral heatmap 2019.

Interesting chart from TD Securities

Corp earnings were grossed up artificially by a doubling of US gov’t spending and debt, far above what US consumers had to use. The debt spiral we’re in now makes statistics

The NY Fed recently updated its recession-risk model – up to 21.4% in December, from 15.8% in November and 14.1% in October. The odds have doubled in the past year and haven’t been this high since August 2008.

Relative sizes of global asset classes….gold is currently at roughly 7 trillion

