what China did with 20 years of Trade surplus

In the future China will employ millions of American workers and dominate thousands of small communities all over the United States .  Chinese acquisition of U.S. businesses set a new all-time record last year, and it is on pace to shatter that record this year. 

The Smithfield Foods acquisition is an example. Smithfield Foods is the largest pork producer and processor in the world. It has facilities in 26 U.S. states and it employs tens of thousands of Americans. It directly owns 460 farms and has contracts with approximately 2,100 others.

But now a Chinese company has bought it for $ 4.7 billion, and that means that the Chinese will now be the most important employer in dozens of rural communities all over America.

Thanks in part to our massively bloated trade deficit with China, the Chinese have trillions of dollars to spend. They are only just starting to exercise their economic muscle.

 It is important to keep in mind that there is often not much of a difference between “the Chinese government” and “Chinese corporations”.  In 2011, 43 percent of all profits in China were produced by companies where the Chinese government had a controlling interest in.

Last year a Chinese company spent $2.6 billion to purchase AMC entertainment – one of the largest movie theater chains in the United States. Now that Chinese company controls more movie ticket sales than anyone else in the world.

But China is not just relying on acquisitions to expand its economic power.

“Economic beachheads” are being established all over America. For example, Golden Dragon Precise Copper Tube Group, Inc. recently broke ground on a $100 million plant in Thomasville, Alabama. Many of the residents of Thomasville, Alabama will be glad to have jobs, but it will also become yet another community that will now be heavily dependent on communist China.

And guess where else Chinese companies are putting down roots?  Detroit.

Chinese-owned companies are investing in American businesses and new vehicle technology, selling everything from seat belts to shock absorbers in retail stores, and hiring experienced                                               engineers and designers in an effort to soak up the talent and expertise of domestic automakers and their suppliers. If you recently purchased an “American-made” vehicle, there is a really good chance that it has a number of Chinese parts in it. Industry analysts are hard-pressed to put a number on the Chinese suppliers operating in the United States.

China seems particularly interested in acquiring energy resources in the United States.

For example, China is actually mining for coal in the mountains of Tennessee.

Guizhou Gouchuang Energy Holdings Group spent 616 million dollars to acquire Triple H Coal Co. in Jacksboro, Tennessee. At the time, that acquisition really didn’t make much news, but now a group of conservatives in Tennessee is trying to stop the Chinese from blowing up their mountains and taking their coal.

And pretty soon China may want to build entire cities in the United States just like they have been doing in other countries.  Right now, China is actually building a city larger than Manhattan just outside Minsk, the capital of Belarus.

 Are you starting to get the picture?

 China is on the rise. If you doubt this, just read the following:

*  When you total up all imports and exports, China is now the number one trading nation on the entire planet.

*  Overall, the U.S. has run a trade deficit with China over the past decade that comes to more than 2.3 trillion dollars.

*  China has more foreign currency reserves than anyone else on the planet.

*  China now has the largest new car market in the entire world.

*  China now produces more than twice as many automobiles as the United States does.

* After being bailed out by U.S. taxpayers, GM is involved in 11 joint ventures with Chinese companies.

*  China is the number one gold producer in the world.

*  The uniforms for the U.S. Olympic team were made in China.

*  85% of all artificial Christmas trees the world over are made in China.

*  The new World Trade Center tower in New York is going to include glass imported from China .

*  China now consumes more energy than the United States does.

*  China is now in aggregate the leading manufacturer of goods in the entire world.

*  China uses more cement than the rest of the world combined.

*  China is now the number one producer of wind and solar power on the entire globe.

*  China produces 3 times as much coal and 11 times as much steel as the United States does.

*  China produces more than 90 percent of the global supply of rare earth elements.

*  China is now the number one supplier of components that are critical to the operation of any national defense system.

*  In published scientific research articles China is expected to become the number one in the world very shortly.

And what we have seen so far may just be the tip of the iceberg.

For now, I will just leave you with one piece of advice – learn to speak Chinese.

Nicholas C. Bozick

Lieutenant Colonel (Ret) Special Forces (USA)

( whatsapp forward)

THE GREAT DEFLATION OF 2022

By Michael Pento vis Pentoport.com

It is not very surprising to me that nearly every talking head on Wall Street is convinced inflation has now become entrenched as a permanent feature in the U.S. economy. This is because most mainstream economists have no clue what is the progenitor of inflation. They have been inculcated to believe inflation is the result of a wage-price spiral caused by a low rate of unemployment.

In truth, inflation is all about the destruction of confidence in a fiat currency’s purchasing power. And there is no better way to do that than for the government to massively increase the supply of money and place it directly into the hands of its citizenry. That is exactly what occurred in the wake of the global COVID-19 pandemic. The U.S. government handed out the equivalent of $50,000 to every American family in various forms of loans, grants, stimulus checks, enhanced unemployment, tax rebates, and debt forbearance measures. In other words, helicopter money and Modern Monetary Theory (MMT) were deployed—and in a big way. The result was the largest increase of inflation in 40 years.

We’ve had some of the highest GDP growth rates in U.S. history over the past few months and the greatest increase in monetary largess since the creation of the Fed. But this is mostly all in the rearview mirror now. Consumer Price Inflation is all about the handing of money directly to consumers that has been monetized by the Fed. It is not so much about low-interest rates and Quantitative Easings—that is more of an inflation phenomenon for Wall Street and the very wealthy.

The idea that Consumer Price Inflation is now a permanent issue is not grounded in science. As already mentioned, inflation comes from a rapid and sustained increase in the broad money supply, which causes falling confidence in the purchasing power of a currency. At least for now, that function is attenuating.

After all, what exactly is there about a global pandemic that would cause inflation to become a more permanent issue in the U.S. economy? In the 11 years leading up to the pandemic, inflation was not a daunting issue—it was contained within the canyons of Wall Street. In fact, the Fed was extremely concerned the rate of Consumer Price Inflation was too low. And, that the economy was in peril of falling into some kind of deflationary death spiral. This is despite ultra-low borrowing costs and money printing from the Fed.

The proof is in the data. The Effective Fed Funds Rate was below one percent from October of 2008 thru June of 2017. The Fed was also engaged in QE’s 1,2, & 3 from December 2008 thru October 2014. And yet, here are the average 12-month changes in CPI for each of the given years:

2009 = -0.3%

2010 = 1.6%

2011 = 3.2%

2012 = 2.1%

2013 = 1.5%

2014 = 1.6%

2015 = 0.1%

2016 = 1.3%

2017 = 2.1%

2018 = 2.4%

2019 = 1.8%

This means, in the 11 years following the start of the Great Recession, all the way through the start of the Global Pandemic, consumer price inflation was quiescent despite the prevailing conditions of zero interest rates and quantitative easings. However, consumer price inflation began to skyrocket by the second quarter of 2021. In fact, it has averaged nearly 5% over the past four months. What caused the trenchant change? It was The 6 trillion dollars’ worth of helicopter money that was dumped on top of consumers’ heads. Regular QE just creates asset price inflation for the primary benefit of big banks and Wall Street.

But, the helicopters have now been grounded for consumers and soon will be hitting the tarmac for Wall Street once the Fed’s tapering commences this winter. Hence, CPI is about to come crashing down, just as is the growth in the money supply. M2 money supply surged by 27% in February 2021 from the year-ago period. But, in June of this year, that growth was just 0.8% month over month, or down to just 12% year-on-year.

The Government Lifeline is Being Cut

The highly-followed and well-regarded University of Michigan Consumer Sentiment Index tumbled to 70.2 in its preliminary August reading. That is down more than 13% from July’s number of 81.2. And below the April 2020 mark of 71.8, which was the lowest data point in the pandemic era. According to Richard Curtin, Chief economist for the University of Michigan’s survey, “Over the past half-century, the Sentiment Index has only recorded larger losses in six other surveys, all connected to sudden negative changes in the economy.”

Of course, a part of this miserable reading on consumer confidence has to do with falling real wages. But I believe the lion’s share of their dour view is based on the elimination of government forbearance measures on mortgages, along with the termination of helicopter money drops from the government. All told, this amounted to $6 trillion worth of bread and circuses handed out to consumers over the past 18 months. This massive government lifeline (equal to 25% of GDP) will be pared down to just 2% of GDP in ’22.

Indeed, this function is already showing up in consumer spending. Retail sales for the month of July fell 1.1%, worse than the Dow Jones estimate of a 0.3% decline. The reduced consumption was a direct result of a lack of new stimulus checks handed out from D.C. Keep in mind that retail sales are reported as s a nominal figure; they are not adjusted for inflation. Hence, since nominal retail sales are falling sharply—at least for the month-over-month period–the economy must now be faltering because we know prices have yet to recede, and yet nominal sales are still declining. This notion is being backed up by applications to purchase a new home, which are down nearly 20% from last year. That doesn’t fit Wall Street’s narrative of a reopening economy that is experiencing strong economic growth and much higher rates of inflation.

On top of all this you can add the following to the deflation and slow-growth condition: Federal pandemic-related stimulus caused a huge spike in the number of Americans that owed no federal income tax. According to the Tax Policy Center, 107 million households owed no income taxes in 2020, up from 76 million in 2019. So, multiple millions more Americans should now have to resume paying Federal income taxes this year because last year’s tax holiday has now expired.

Oh, and by the way, the erstwhile engine of global economic growth (China) is now blown. China’s huge stimulus package in the wake of the Great Recession helped pull the global economy out of its malaise. This debt-disabled nation is now unable to repeat that same trick again.

Back to the U.S., the Fed facilitated Washington’s unprecedented largess by printing over $4.1 trillion since the outbreak of COVID-19—doubling the size of its balance sheet in 18 months, from what took 107 years to first accumulate.

But all that is ending now. Next year has the potential to be known as the Great Deflation of 2022. This will be engendered by the epiphany that COVID-19 and its mutations have not been vanquished as falsely advertised, the massive $6 trillion fiscal cliff will be in freefall, and the Fed’s tapering of $1.44 trillion per annum of QE down to $0, will be in process.

Then, the economy will be left with a large number of permanently unemployed people and businesses that have permanently closed their doors. And, the $7.7 trillion worth of unproductive debt incurred during the five quarters from the start of 2020, until Q1 of this year, which the economy must now lug around.

All this should lead to a stock market that plunges from unprecedentedly high valuations starting next year. And, in the end, that is anything but inflationary. Indeed, what it should lead to is more like a deflationary depression. But the story doesn’t end there. Unfortunately, that will cause government to change Modern Monetary Theory from just a theory to a new mandate for the central bank. And hence, the inflation-deflation, boom-bust cycle will continue…but with greater intensity. The challenge for investors is to be on the correct side of that trade.

https://pentoport.com/the-great-deflation-of-2022/

The new GBTC- Uranium

By Kuppy via AdventuresinCapitalism.com

September 2, 2021

Last summer, I recognized an odd phenomenon. An obscure entity named Grayscale Bitcoin Trust (GBTC – USA) was slowly cornering the free float in Bitcoin. This was a result of the trust structure where any capital that went in, was converted into Bitcoin, but there was no mechanism in place to ever sell coins and redeem that capital. As a result, GBTC became a growing repository of Bitcoin. At first, it bought a few hundred coins a day, then a thousand, then a few thousand. As the trading volume increased, the inflows also increased. As the inflows increased, the daily bitcoin purchases increased, eventually driving the Bitcoin price higher. As the price went higher, new investors were drawn to GBTC and the inflows accelerated—spinning the flywheel faster. It was so obvious that this would lead to higher prices, that I called it “My Favorite Ponzi Scheme…” Over time, much as I had predicted, these inflows drove the price of Bitcoin and ultimately GBTC dramatically higher. Early this year, I had a well-timed exit for a quick multi-bagger and my capital went onto greener pastures in depressed energy assets.

I bring this all up, as I see a similar phenomenon in uranium—a much smaller and less liquid market, potentially creating a more dramatic effect should inflows accelerate. Long-time readers of this site will remember that I have a sweet spot for Uranium. I wrote about it back in 2019 but sold out during the first quarter of 2020 as the global equity markets collapsed and better opportunities presented themselves. At the time, the thesis, while directionally accurate, didn’t pan out as the supply deficit was insufficient to overcome above-ground stockpiles, capping price discovery.

In the year and change since I sold out, the overall supply deficit has continued to increase, while above-ground stockpiles have continued to be consumed. While uranium aficionados like to fixate on calculating the current deficit to the nearest decimal, for the sake of this post, let’s use some VERY broad numbers. The world is producing roughly 125 million pounds from primary mining, 25 million pounds from secondary sources and consuming roughly 180 million pounds, for an overall deficit of 30 million pounds a year. This deficit will only increase in future years, as additional reactors come online. If you want to quibble with my numbers, quibble away. I know I’m off by a few million pounds, but so is everyone else. No one really knows the true numbers—which is what makes commodity markets so fascinating in the first place. All that matters is that there is a deficit, it’s a big percentage of total production, new mines are not coming online at current prices and existing mines have had years of under-investment—hence production should continue to trail off without new investment.

How large are the above-ground stockpiles? No one knows. All we know is that they’re drawing down rapidly and outside of government entities, most of the stockpiles are spoken for by utilities, which are using their uranium to fabricate finished products for their reactors. However, a new class of investors has entered the market and they’ve completely upended the equilibrium.

My Favorite Ponzi Scheme…

Remember, GBTC?? I remember it quite fondly. What if I told you there’s another entity doing the same thing in uranium, but it is cornering the free float at a rate that makes the boys at GBTC look like amateurs? What if the free float is organically shrinking due to the supply deficit? What will happen as institutional investors jam themselves into a far smaller market? Fukit, who cares? Someone intends to conduct this science experiment; consequences be damned. Importantly, this entity is using an At The Market offering (ATM). Hence, it immediately produces free trading shares; increasing trading volume far more rapidly than GBTC with its 6-month hold—making acquisition by institutional investors possible and driving adoption. Basically, it’s GBTC 2.0—issue shares to buy product. Every day. Relentlessly. Except, against a smaller and shrinking asset class.

Remember, no one ever needs a bitcoin. Everyone who is long Bitcoin is a potential seller and on the way up, they’ll all eventually sell. Uranium is different—almost everyone who owns uranium today, owns it because they intend to consume it—these owners are all incremental buyers going forward. In a market with a deficit, they’re all implicitly short uranium. With an entity buying up the free float, they’re going to get squeezed. We all know how squeezes work, but I don’t know of any similar scenario where the squeeze was as aggressive or blatant. The utilities are blissfully unaware, they’re eventually going to panic and pay any price for uranium.

There is one other unique quirk to the uranium market when compared to Bitcoin. No one actually needs a Bitcoin. A nuclear reactor is a VERY expensive paperweight if it cannot procure uranium. As above-ground stockpiles are depleted and remaining pounds disappear into a trust that will not sell those pounds, there’s a good chance that reactors are forced to bid aggressively against this entity for the remaining available pounds.

Sprott Physical Uranium Trust commonly known as SPUT (U-U – Canada), is the entity that has upended the uranium market. Since launching its ATM 13 days ago, it has acquired 2.7 million pounds of uranium. This is an average daily rate in excess of 200,000 pounds or roughly a third of global production on an annual basis. If GBTC is the roadmap to follow, as the price of uranium begins to appreciate, the inflows into the trust should accelerate. Interestingly, there are plenty of other entities also purchasing physical uranium, uranium that utilities were counting on for their future needs. The squeeze is on.

As expected, the utilities are blissfully unaware. Surprised?? I’m not. Utilities are quasi-governmental agencies, managed by the types of fukwits who’d work at your local DMV, except they enjoy stock options. The fact that they’ve ignored the coming squeeze shouldn’t be surprising. Inevitably, they’ll demand rate increases to buy back this uranium–it’s not their money anyway. This is your bid at some point in the future.

Commodities are determined by supply and demand. Uranium is a small market at roughly $6.3 billion in annual consumption (180 million pounds at $35/lb). SPUT has raised approximately $85 million in the 13 days since the ATM went live. It’s hoovering up supply and is already struggling to procure pounds, as shown by their increasing cash balance—cash that they’re legally forced to spend. Something is going to give here, and I suspect it’s the price of uranium.

In any case, when I saw the rate at which SPUT was issuing shares, I legged into a rather large pile of SPUT. I’m also long a few producers along with some juniors for extra kick. (Please don’t ask me which—if I wanted to name them, I would have). Uranium just broke out to 5-year highs. New highs bring in publicity, which often brings in new buyers and the cycle repeats. I like buying new highs from a big base—especially with SPUT out there playing Pac-Man. I pulled back my exposure all summer as I was awaiting something interesting. I don’t think I’ll see anything better than uranium for a while. Let’s just say that I’m suddenly back to being VERY fully invested.

Caveat Emptor  

Disclosure: Funds that I control are long SPUT and various other uranium related entities

If you enjoyed this post, subscribe for more at http://www.adventuresincapitalism.com

(In)Stability

By Kuppy via adventuresincapitalism.com

August 19, 2021

This weekend, I watched in baffled amazement as our President and his entire administration went on vacation, abandoning tens of thousands of Americans, along with allied citizens, to their fate in Afghanistan. America has done some embarrassingly dumb things during my lifetime, but this one displayed a special sort of arrogance and incompetence that can only develop through years of hubris, gross negligence, and dereliction of the basic tenets of governance.

Let me state categorically that we should have gone home from Afghanistan long ago. What started as a mission to track down Osama bin Laden, morphed into an impossible adventure with nebulous goals, many of which were unobtainable and quite ludicrous. That said, four Presidents and countless generals all had time to strategize and plan our exit. This weekend’s events were truly a colossal klusterfuk of the highest order, overseen by the most senior leadership of our nation. Despite two decades to strategize and war-game this inevitable event, these assholes literally had no plan to extract our people and send them home safely. It seems that our leadership was as baffled and mesmerized by the events as I was.

An educated observer of world affairs will craft their own opinion of things. I don’t think anyone expected the corrupt Afghan government to hold things together once the American military went home. Everyone knew the situation was highly combustible. However, after two decades of stability, everyone close to the situation had chosen to ignore the true facts on the ground. Sure, they all assumed that when the military went home, it would collapse, but it was expected to take years, not days. Then again, after two decades where a highly unstable situation remained stable, everyone in leadership grew numb to just how unstable the situation really was.

I bring this all up because the whole world is on the Federal Reserve standard. All of us intuitively know that markets, in general, are highly unstable. The current market is particularly unstable—only held aloft, at stratospheric valuations, by excessive money printing. Every time there’s been a whiff of reduced QE or a threat of rate increases, the market has melted, and the Fed has ridden to the rescue. As a result, we have all implicitly accepted that the Fed will always be there to protect the market should things get more than a bit out of hand—much like the Afghans expected the US military would be there backing them up forever. We just saw how rapidly an army can melt away when their protector leaves the field. What if the Fed does the same to the markets?

Jack Dorsey celebrates the Taliban victory…

Of course, no one can conceive of an event where the Fed is forced to step away. That outcome seems so far outside of our recent experience, that it is assumed to be impossible. What if it isn’t? Just because the Fed has been there for the past two decades, roughly the same period overlapping with our occupation of Afghanistan, doesn’t mean that it will be there for the next two decades.

One of the scariest market-related black swans I can think of, is a situation where the Fed cannot intervene—especially as everyone assiduously expects that the Fed will always be there. Am I crazy to think that as inflation accelerates, the Fed will increasingly be boxed into a corner? The Fed has never really been independent of political action. What if the voters begin to complain about their cost of living? Do you not expect for the politicians to step in and demand a fix? What if the Fed suddenly needs to show a backbone and pretend to tame inflation for political reasons? Is anyone positioned for that? I know I’m not. Instead, I’m positioned for them simply ignoring the accelerating inflation that they’re causing.

I’m not here making a market call—I’m actually quite long a bunch of inflation assets. Rather, I’m pointing out that unstable things can go bad in a hurry. If the Fed were ever forced to step back, even for a moment, it would be cataclysmic for the markets—much like the US military stepping back in Afghanistan. Unstable situations inevitably implode—they can only be propped up for so long. Sometimes, we grow numb to something that’s unstable and assume that since it’s gone on for a long time, it will continue.

The vast majority of Afghans came of age during the US occupation. Nothing else seemed possible to them. Then came the shock. Most market participants today only know of the Fed’s ability to prop up markets. Is anyone prepared for a Fed that has to fight AGAINST escalating inflation?

Never Forget….

While I anticipate that we’re on a path called “Project Zimbabwe,” I also realize that this isn’t a linear path. Unstable things tend to crumble. What if the Fed needs to step in and fight inflation—rather than ignoring it? What if it is the Fed that’s suddenly draining the punchbowl, instead of refilling it as was expected? I realize that it’s unlikely, but I always keep this in the back of my mind. You should too.

I like to remind people that if you’re going to panic, make sure to panic first. Artificial systems are unstable—when they turn, it’s sudden and violent. Don’t get caught on the wrong side by assuming that an unstable system will forever remain stable.

If you enjoyed this post, subscribe for more at http://www.adventuresincapitalism.com

when will the Pandemic rally probably end

I recently had a chance to connect with Neppolian of Jade finance and below is the summary of main points

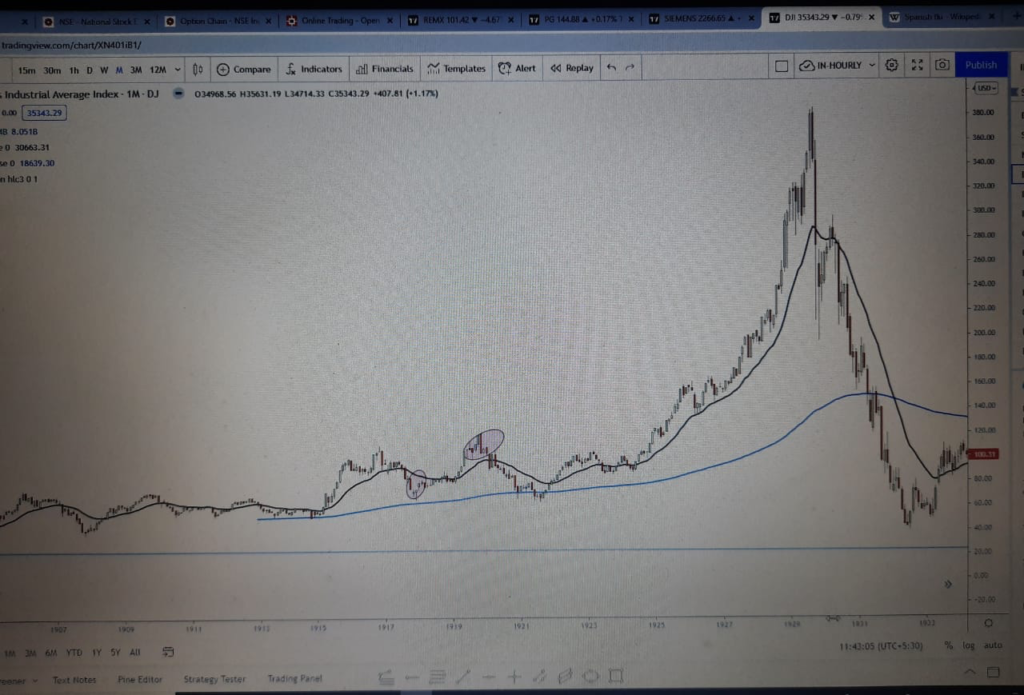
Analogy of Spanish Flu from Feb 1918 to April 1920: using DOW

1. The index bottomed in Dec 1917 (ending a 13 month bear market from Nov 1916 suffering a 40% drop). 

2. Markets rallied ahead of the arrival of Spanish Flu proving once again that there is no better lead indicator than financial markets.  Spanish Flu originated in US in Feb 1918 as an antidote to end the previous bear market. (We had amply proved in our 2014-15 pandemic report that, pandemics have historically bullish for markets and generally stike at the fag end of a bear market). 

3. Dow rallied 85% from the bottom to register a top in Nov 1919. So, Dow topped 4 months before the Spanish Flu officially ended in April 1920. By April 1920, Dow had already corrected 25% from the top. Markets again proved to be the leading indicator.  

4. Dow eventually fell much deeper and went on to retest the Dec 1917 bottom in August 1921. Then it was testing the 200MMA support. 

5. The bear move began after the Dow closed under 20MMA in Feb 1920. 

6. We don’t know, as of now , when will the Covid19 pandemic end. We do hear certain voices that by Mid 2022 the Covid19 pandemic may largely be over. However, going by history,  the markets may top out and begin a correction a few months ahead of the pandemic officially ending. 

7. Dow has rallied 95% from the Covid19 bottom of 18200. We are into the 17th month of rally from the bottom. 

8. Technically Dow looks stretched with collapsing internal breadth numbers. 

9. The signal to sellout (20MMA) is now at 30600, approximately 15% lower. Portfolio may suffer badly by the time we wait for the breach of 20MMA. It may not be out of place, actually may be prudent to consider proactive profit taking from CMP of 35600 to further upsides if any.

10. The 200MMA is now placed at 18600. Though in the Spanish Flu of 1918, Dow eventually fell to test 200MMA , we are in no way advocating that it would so this time around too, but our endeavor is to lock in profits when the markets allows us rather than sell in panic when it reverses. 

11. It is to be remembered and noted that post the August 1921 bottom retest , the DOW launched itself into the most biggest rally of 8 years upto 1929. The antidote provided by a pandemic is generally long term and a bullish sign for the decade. 

However,  portfolios survive better by being light at market tops and heavy at market bottoms. 

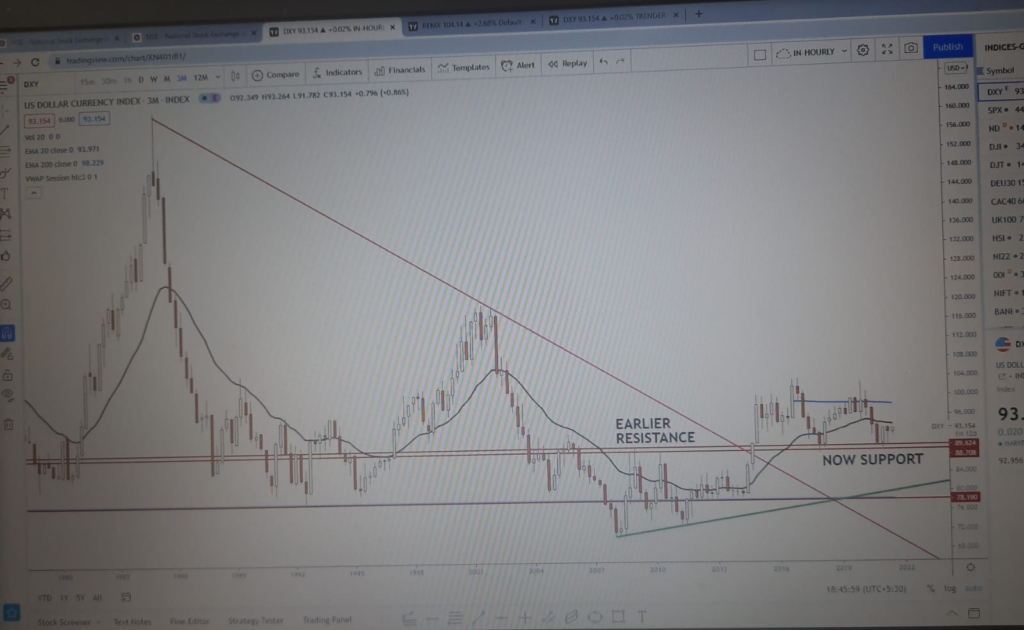
Also we had a talk on US dollar whose direction decides the fate of risk assets


usd quarterly…..the bear camp is neglecting the horizontal support of 89-88 zone. I had noted this even earlier when usd waz at 89 and every one had super bearish targets on the downside….that’s  why I had suggested a possibility of usd making a counter rend move to 94-95. 
 
The black MA on the chart is a 20QMA….placed now at 94….any close abv should be viewed as an important development in the near term. Then in all probability a move to 98 will become live. That would be detrimental to risk assets.  

When to FOLD them

via Zerohedge

By Nicholas Colas of DataTrek Research

Highly skilled equity managers know how to find great stocks, but they are not so good at knowing which positions to sell. That observation comes from a recently published paper which is the subject of this post. The problem here is one of attention. Great PMs spend a lot of time looking for the next big idea and much less on evaluating their current positions. When they sell, that information gap leaves them open to unproductive mental shortcuts. Good news: the paper’s findings point to 4 hacks around this problem.

* * *

The decision to buy or sell a stock should be based on the same question: how will it perform in the future? Therefore, you’d think that highly skilled portfolio managers would be good at both. They should (generally) pick winners and sell them when they’re about to stop working.

A recently published NBER paper shows that’s not what happens, however. The paper’s title, “Selling Fast and Buying Slow: Heuristics and Trading Performance of Institutional Investors”, is a nod to Daniel Kahneman’s book “Thinking, Fast and Slow”. We love a good behavioral finance story, so the paper’s findings and our thoughts on them are the subject of this week’s Story Time Thursday.

The study, done by researchers at the University of Chicago, MIT, and UK data firm Inalytics, (link to the full paper below) looked at buy and sell decisions across 783 actively managed portfolios from 2000 to 2016. All portfolios were unlevered and actively managed by institutional, long-only managers who make concentrated bets (average of 80 positions at any one time). They outperformed by an average of 2.6 points/year over their benchmarks during this period, so we’re talking about a skillful group of individuals.

This graph summarizes the researchers’ key finding: these PMs were great at buying the right stocks, but not so great at knowing which names to sell out of their portfolios. The left side bar graph shows that these managers on average picked winners versus their benchmark. Great, but … The graph on the right shows they would have been better off either 1) selling a small part of every name in their portfolio or 2) randomly picking a name to ax, rather than selling the name they chose to cut loose.

Chart, box and whisker chart

Description automatically generated

The paper’s authors believe that “the stark discrepancy in performance between buys and sells is consistent with an asymmetric allocation of limited cognitive resources towards buying and away from selling”. In layman’s language, there’s only 24 hours in a day and PMs spend most of that time looking for the next hot investment idea. That leaves less time for keeping up on the names they already own. When pressed to sell out a position, therefore, they lean on counterproductive heuristics (mental shortcuts).

As odd as all this sounds, the realities of running a money management business do (sort of) demand it:

  • Describing new and interesting investment ideas is a huge part of the marketing process for investment managers. Many fund-raising meetings start with the allocator asking “OK, tell me a stock story I haven’t heard before”. Of course a PM is going to allocate more time to finding a new name rather than having to discuss something they’ve owned for a while and will therefore seem stale.
  • Wall Street doesn’t care about counterfactuals. If a PM has a winning record, they will generally be able to find new clients. “You’re a great money manager, but you sell the wrong names so I’m not giving you any money to manage” has never been said by anyone, ever.

Even with that cynical (but absolutely correct) second point, the paper does still offer 4 actionable observations that we believe are applicable to anyone looking to improve portfolio performance:

  1. When a good investment process leads you to an idea, do all the work up-front and size it appropriately (i.e., no “cheerleading positions” – make it count). Selling low-conviction ideas (as measured by portfolio weighting) was responsible for most of the underperformance the researchers found in the data. These were names the PM had put on the sheet in a small way, but had not felt confident enough to size up. When they found something they thought was better, they ditched the small holding to fund their next purchase.
  2. It can often be a good idea to wait for the next earnings report before selling. Researchers found that sales made on earnings announcement dates “substantially” outperformed the random-sale counterfactual (randomly selling a name or just cutting back the entire portfolio evenly). Oddly, purchases made on earnings announcement days saw no net outperformance versus other buys.
  3. Don’t just focus on whether a name has been a big winner/loser for you when deciding to sell. Past performance is not a predictor of future returns, but the PMs studied still sold outliers (big winners or big losers) at rates “more than 50 percent higher” than other positions. As with the prior point, this bias did not exist when PMs made Buy decisions.
  4. Value investors beware; the paper found that “funds that score higher on value appear to underperform most in selling”. Momentum strategy portfolios, by contrast, had no selling underperformance over the 1 year after their sales.

The bottom line to all this: where the head goes, the portfolio follows. Finding new ideas to own requires a disciplined approach, but so does making sales. The paper’s key finding is that even highly skilled managers mentally overweight “buying” and underweight “selling”, leaving them open to a range of unproductive heuristics when deciding to unload a position. The good news – for them and for all investors – is that correcting this imbalance comes down to just paying a bit more attention to what’s already in the portfolio.

European Energy prices creates record.

The mindless pursuit of “green and clean energy” without creating an efficient alternative to fossil fuel will in all likelihood lead to an unproductive continent.

Look at some charts below

The above charts tell you the story of energy prices in Europe. Emerging countries like India needs to carefully watch the cost associated with energy transition.

After the GOLD rush

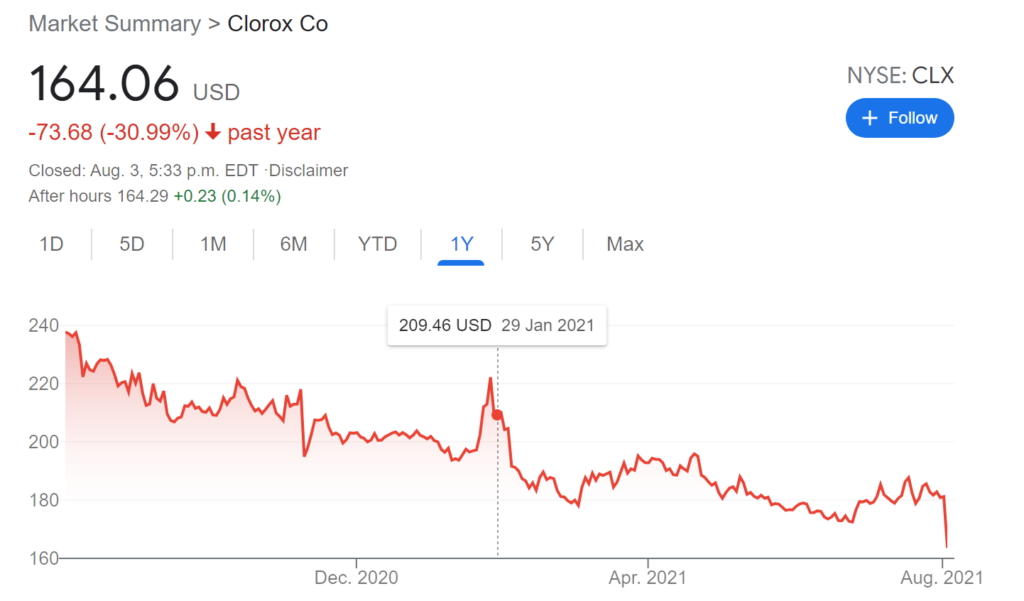
The US disinfectent maker announced its results

Clean up in aisle four. Shares in Clorox Co. sank by nearly 10% today, after the household products giant reported $0.95 cents in adjusted earnings per share, well below the $1.32 consensus, and took an axe to its 2022 guidance with a projected $5.55 per share (using the midpoint of the provided range) compared to analyst expectation of $7.60.

Dueling factors conspired to bring the hammer down.  On the one hand, management noted a “deceleration of shipments from peak levels [seen] during the Covid-19 pandemic,” as customer spending habits mean revert from the widespread stockpiling last year.  That’s a change from the prior quarter, when the company anticipated that spending habits would remain “sticky.”   

Indeed, last year’s spate of panic buying helped goose sales and push CLX shares higher by 56% over the first half of 2020, setting the stage for subsequent disappointment and providing an opportunity for the skeptics.  As a bearish analysis in the Oct. 2 edition of Grant’s Interest Rate Observer concluded, “Mr. Market may be valuing Clorox on a fancy multiple of spurting, one-off earnings.” Shares are since off by 20%, dividends included, compared to a 33% advance in the S&P 500. 

Broader factors also loom large.  Management warned on today’s call that it expects gross margins in the current fiscal first quarter to contract by 1,000 to 1,300 basis points year-over-year due to “significant cost inflation.” For context, gross margins declined by 970 basis points year-over-year in the quarter ended June 30, nearly double the shrinkage anticipated by Wall Street. ( input price inflation which they are not able to pass on)

Not taking that lying down, the c-suite relayed that it is in the process of raising prices on products representing 50% of its total portfolio.  Additionally, Clorox is laying the ground work for price hikes across other product categories to be announced “at a later date.”

https://www.grantspub.com/almostDailyHTML.cfm?dcid=911&article=1&email=riteshmjn%40outlook%2Ecom

India launches contactless digital payment solution e-rupi

I am reproducing an article written in Indian express on the above subject with my comments. I think this is a step in direct direction and will help in creating ground for the launch of India’s Digital currency.

e-RUPI is a cashless and contactless digital payments medium, which will be delivered to mobile phones of beneficiaries in form of an SMS-string or a QR code.

Written by Pranav Mukul 

This will essentially be like a prepaid gift-voucher that will be redeemable at specific accepting centres without any credit or debit card, a mobile app or internet banking. (this is important distinction)

Taking the first step towards having a digital currency in the country, Prime Minister Narendra Modi will launch an electronic voucher based digital payment system “e-RUPI” Monday. The platform, which has been developed by the National Payments Corporation of India (NPCI), Department of Financial Services, Ministry of Health and Family Welfare and the National Health Authority, will be a person-specific and purpose-specific payments system.

How will e-RUPI work?

e-RUPI is a cashless and contactless digital payments medium, which will be delivered to mobile phones of beneficiaries in form of an SMS-string or a QR code. This will essentially be like a prepaid gift-voucher that will be redeemable at specific accepting centres without any credit or debit card, a mobile app or internet banking. e-RUPI will connect the sponsors of the services with the beneficiaries and service providers in a digital manner without any physical interface. ( this will ensure complete stop on leakage, be more targeted and save money for govt.

How will these vouchers be issued?

The system has been built by NPCI on its UPI platform, and has onboarded banks that will be the issuing entities. Any corporate or government agency will have to approach the partner banks, which are both private and public-sector lenders, with the details of specific persons and the purpose for which payments have to be made. The beneficiaries will be identified using their mobile number and a voucher allocated by a bank to the service provider in the name of a given person would only be delivered to that person. ( Elimination of bureaucratic govt machinery with instant implementation)

What are the use cases of e-RUPI?

According to the government, e-RUPI is expected to ensure a leak-proof delivery of welfare services. It can also be used for delivering services under schemes meant for providing drugs and nutritional support under Mother and Child welfare schemes, TB eradication programmes, drugs & diagnostics under schemes like Ayushman Bharat Pradhan Mantri Jan Arogya Yojana, fertiliser subsidies etc. ( think about efficieny and complete eradication of corruption).The government also said that even the private sector can leverage these digital vouchers as part of their employee welfare and corporate social responsibility programmes.

What is the significance of e-RUPI and how is it different than a digital currency?

The government is already working on developing a central bank digital currency and the launch of e-RUPI could potentially highlight the gaps in digital payments infrastructure that will be necessary for the success of the future digital currency.( this is the first step in launching digital currency and govt is using welfare schemes delivery as a guinea pig) In effect, e-RUPI is still backed by the existing Indian rupee as the underlying asset and specificity of its purpose makes it different to a virtual currency and puts it closer to a voucher-based payment system.

Also, the ubiquitousness of e-RUPI in the future will depend on the end-use cases.

What are the plans for a central bank digital currency (CBDC)?

The Reserve Bank of India had recently said that it has been working towards a phased implementation strategy for central bank digital currency or CBDC — digital currencies issued by a central bank that generally take on a digital form of the nation’s existing fiat currency such as the rupee. Speaking at a webinar on July 23, RBI deputy governor T Rabi Sankar said that CBDCs “are desirable not just for the benefits they create in payments systems, but also might be necessary to protect the general public in an environment of volatile private VCs. While in the past, RBI governor Shaktikanta Das had flagged concerns over cryptocurrencies, there seems to be a change of mood now in favour of CBDCs on Mint Street. Although CBDCs are conceptually similar to currency notes, the introduction of CBDC would involve changes to the enabling legal framework since the current provisions are primarily synced for currency in paper form.

Does India have appetite for a digital currency?

According to the RBI, there are at least four reasons why digital currencies are expected to do well in India: One, there is increasing penetration of digital payments in the country that exists alongside sustained interest in cash usage, especially for small value transactions. Two, India’s high currency to GDP ratio, according to the RBI, “holds out another benefit of CBDCs”. ( elimination of black money is the agenda here) Three, the spread of private virtual currencies such as Bitcoin and Ethereum may be yet another reason why CBDCs become important from the point of view of the central bank. As Christine Lagarde, President of the ECB has mentioned in the BIS Annual Report “… central banks have a duty to safeguard people’s trust in our money. Central banks must complement their domestic efforts with close cooperation to guide the exploration of central bank digital currencies to identify reliable principles and encourage innovation.” Four, CBDCs might also cushion the general public in an environment of volatile private VCs.

Are there global examples of a voucher-based welfare system?

In the US, there is the system of education vouchers or school vouchers, which is a certificate of government funding for students selected for state-funded education to create a targeted delivery system. These are essentially subsidies given directly to parents of students for the specific purpose of educating their children. In addition to the US, the school voucher system has been used in several other countries such as Colombia, Chile, Sweden, Hong Kong, etc.

Explained: What is e-RUPI and how does it work? | Explained News,The Indian Express

Conversation with one of the best technical analyst

I have shared Neppolian views on markets on this blog in the past. I got one more opportunity to pick his sharp mind to understand the polarization in markets.

Below is the summary of main points

1. Global markets are a fragmented lot. Most Asian indices like Nikkei,  Hangseng, Shanghai composite etc topped in Feb 2021 and have been correcting for the last 5 months and have already dropped 10+%.

2. In US too, fragmentation is visible. Even as Nasdaq/SP500 making new highs, Dow Jones Transportation index has been correcting for the past 2 months and RT2000 for the past 4 months.

3. Most European markets have gone sideways.

4. Market internals are crumbling,  even as the mainline indices are trading closer to ATH.

5. This looks like the classic reactionary phase, post a big 100% gain period. May continue to rumble like this before a trend resolution is found.

6. In general,  reactionary phase or consolidation phase could take the shape of a slow correction or at rare times a sharp collapse.  Usually,  the developed markets will go through a slow correction and emerging markets a sharper correction. Anywhichways, after a solid run uptrend, a consolidation phase usually resolves in the direction of the earlier uptrend.

7. A repeat of 2020 like quick and deep collapse is ruled out. Markets have a way with not behaving in similar or recent manner eventhoigh most participants may look forward to similar collapse or rallies being themselves anchored to a malady known as recency bias. So we are not likely to get either a deep collapse or a rampant rally for some time.

8. That said, Indian markets are made of stocks rather than indices.  In India,  there is good participation from across sector. Broad basing is happening and is good for the structure of the markets. Many stocks are making new ATH after 2017-18, especially quality mid and small caps.  This is suggestive of leadership through these names for at least next 2-3 years. So large upsides may yet be realizable.  So buy on dip strategy will work in such names and sectors. However,  unless one is ready to keep or work with a deep stop such names/sectors will practically be not tradable.  In India,  we have seen a year or year rolling 100% index gains only a few times (91-92), 2003-04 and 2008-2009 and each of these times the indices doubled,  either we have seen a sharp collapse or a lengthy time consolidation running into years. Participants may expect a repetition of the past behavior but market may/not oblige.

 9. Markets are looking stretched and tired in the near term, but at the same time, setup wise looks structurally long term bullish.  Generally,  when the markets expand to a new ATH beyond 161.8% measured from the previous bear trend, in future corrections (even the deepest ones) do not  fall below the previous top or inverse 132.8% levels…..these levels for Nifty would read as 12500 and 10000 as of now. So, 12500 would require a 20% fall and 10000 would require a 33% fall from current market price.  In India 20-30% fall is where most bear market end….barring exception of 2008 and 2020.

10. So in my sense, Long term portfolio can still be built but can be done only if the stops are kept at such levels to persevere at least 20% index correction. Till the markets reach a reasonable support level between 14000-12500, the best strategy would be to hold a very flexible portfolio of momentum + base breakout type stocks. Also, the exit rules will have to be a combination of individual stock based stops or market wide level stops.  This would require a mindset to build-exit-rebuild continuously. 

11. Also the new clutch of money coming into Indian markets from the retail/non professional group is humongous. We must welcome this money with open arms as these are likely to permanently increase liquidity in the markets…as I certainly feel 90-95% of these Covid19 breed of traders will eventually loose and give a permanent liquidity boost to the professional traders. So deepening of the liquidity in Indian markets is a given.

12. Net net , one must look for opportunities to go long of stocks in meaningful dips.  Till these meaningful dips come , run a flexible portfolio.