Ethereum is up 10000% in last 16 months

ETHEREUM…. I bet you havent heard about it ? it is the second biggest crypto currency behind Bitcoin ( now famous for wannacry hackers demand) with a market cap of USD 8.4 billion.

At the end of 2015, it was worth $0.90., it’s now worth $91.30. Those who bought it at the end of 2015 had a ten-bagger on their hands by January 16, 2017. I had written an article highlighting the move in cryptocurrency on 26th jan 2017 http://worldoutofwhack.com/?s=cryptocurrency . Those who bought at that time also have ten bagger on their hands. Those that rode it all the way up over the 16 months have a 100-bagger. For percentage fans, that’s a gain of 10,000%.

What miracle “asset” did they get when they bought it? Don’t even ask. Just believe in it. It certainly isn’t a usable currency for legit purposes, obviously, given this kind of insane instability. But it really doesn’t matter what it is as long as it is going up.

The largest one is bitcoin with a “market cap” of nearly $30 billion. I have been personally watching it from $400 wanting to buy it but was not sure about its legitimacy in India hence gave it a pass. The value of a single bitcoin, at $1,789 on Sunday, is 46% higher than the value of one troy ounce of gold ( as it is a much smaller market easy to manipulate ). In mid-May 2015, bitcoin was at $240. Over the two years since, it has soared 645%

This is being played with real money. That it will inflict maximum pain on the latecomers – whenever this happens – is now perfectly clear.

There are over 830 “alt-coins,” as the alternatives to bitcoin are called, out there, with new ones being added constantly. The “market cap” of all these cryptocurrencies combined, according to the Financial Times, has pierced the $50 billion mark. So this starting to involve serious money.

Many of these investors may not be “sophisticated.” But others appear to be highly sophisticated, now that the sums involved have gotten big enough for them. The FT:

Observers say many individuals are trading alt-coins from corporate IT departments, concentrated in the financial sector and falling under the radar of senior executives. Many are sitting on virtual fortunes, but are unable to liquidate their cash as banks clamp down on measures to avoid money laundering.

“Systems are being used here by employees to increase their own individual wealth. In the process, corporate systems are coming into contact with the fringes of the criminal world,” Brian Lord, former deputy director for intelligence and cyber operations at the UK’s electronic espionage agency GCHQ and now head of cyber practice at security group PGI, told the FT.

Big sophisticated traders – including hedge funds and others – are in this trade, not because it might make some real economic sense, but because, as the charts above show, these things can be pushed up quickly with enough money involved. And if enough new people can be drawn in due to the ballooning hype, then the big boys can get out, once they figure out how to deal with the banks’ concerns about money laundering.


The Big Picture by Ray Dalio

The Big Picture

Big picture, the near term looks good and the longer term looks scary. That is because:

The economy is now at or near its best, and we see no major economic risks on the horizon for the next year or two,
There are significant long-term problems (e.g., high debt and non-debt obligations, limited abilities by central banks to stimulate, etc.) that are likely to create a squeeze,Social and political conflicts are near their worst for the last number of decades, and Conflicts get worse when economies worsen.
So while we have no near-term economic worries for the economy as a whole, we worry about what these conflicts will become like when the economy has its next downturn.

The next few pages go through our picture of the world as a whole, followed by a look at each of the major economies. We recommend that you read the first part on the world picture and look at the others on individual countries if you’re so inclined.

Economic Times ” what i read this week”

Bank drilling hole in safe deposit box over missing information

Three different Bank of America customers in san Francisco say they were blindsided when the bank recently drilled and emptied their safe deposit boxes without their permission or the required notice. They say the bank then lost or damaged tens of thousands of dollars’ worth of property that was removed from those boxes. However, most shocking for some, the bank drilled the boxes due to missing account information that the customers say the bank had all along. According to the Office of Comptroller of Currency, which regulates safe deposit boxes, banks may drill a box without permission due to a court order, search warrant, delinquent rental fees, requests from estate administrators or if the bank is closing a branch. Safe deposit box consultant Dave McGuinn says he’s recently been hired as an expert witness on 17 different cases involving various big banks, and notes that federal law does require banks to provide customers with adequate notice. “Notification should be made by registered letter or certified return receipt letter so the bank has proof that notice was sent out,” McGuinn explained. He trains bank employees on proper safe deposit procedures and says in these cases, Bank of America also had an obligation to flag the customers’ accounts. Most people don’t realize safe deposit boxes are not insured unless you purchase a separate policy from a third-party insurer or add a rider to your homeowner’s policy. Many are also shocked to find out that the banks’ liability is limited under the rental agreement. consumers have little recourse when a bank decides to drill a box and subsequently damages or loses the valuables inside. They say lawyers generally don’t take these cases unless the losses exceed tens of thousands of dollars and banks rarely reimburse customers for losses on their own accord.

Read More

http://sanfrancisco.cbslocal.com/2017/05/06/customers-complain-bofa-is-drilling-safe-deposit-boxes-and-losing-valuables/

Housing for all to kickstart the economy

Private investment has come to a standstill and although more attention is given to job losses in IT sector, the biggest job losses are in construction and real estate sector. Prime minister Narendra Modi’s ambitious plan to build homes for all Indians by 2022 could spark an economic revolution worth $1.3 trillion and kickstart the economy. Between 2018 and 2024, some 60 million new homes are set to be built, mostly under the government’s affordable housing programme, as Asia’s third-largest economy looks to upgrade its people’s quality of life. This is expected to create over 2 million jobs annually and add up to 75 basis points to India’s GDP, brokerage firm CLSA said in a report last week. “The housing sector is at a tipping point and will be the economy’s next big growth driver,” the report said. “The catalyst is the government’s big push for an ambitious housing program. “In the past five years, mortgage rates have dropped 250 basis points, property prices have remained broadly stable and per capita incomes have posted a 10% CAGR,”. The leverage levels in lower to middle income household are low as compared to other countries and hence the debt servicing will be easier in affordable housing segment .

Read More

https://qz.com/979059/indias-economy-is-set-for-a-1-3-trillion-bonanza-from-60-million-new-homes/

Good quality jobs are vanishing in IT, telecom and Finance

So much has been written on job losses in IT sector with all kind of statistics but this article by R jagannthan drowns out the noise and deal with facts . He writes that IT , telecom and financial services job landscape is changing dramatically and he outlines the reasons . One is the shift in demand from plain-vanilla software maintenance and related services to SMAC – short for social media, mobile technology, artificial intelligence and cloud computing. Indian software services, with its emphasis on using cheap engineering skills, cannot any more create jobs only due to the cost arbitrage advantage. It must move up the skills ladder, as lower-skills jobs can now easily be automated. Skills are in demand in SMAC, and not in the old areas where India dominated. This means not only will the IT industry recruit less, but even this lower numbers will be heavily tilted towards high skillsets in SMAC.Two, there is a huge bulge at the middle of the software services sector. Three, India’s biggest market – in North America – is turning protectionist, and H1B visas, will not only be costlier, but may also carry higher minimum wage barriers that deny Indian engineers their cost advantage.

However, the impending diminution of high-quality jobs is not going to be restricted to IT services alone. While IT services are expected to lose over six lakh low-skilled jobs due to automation by 2021, two other sectors – banking and telecom, both in the throes of consolidation due to competition and slimming margins – are also likely to shed jobs. One report puts jobs losses in IT, banking and financial services, and telecom at nearly 1.5 million over the next couple of years.

Banking is changing due to technology. With the advent of the smartphone and e-banking, banks no longer need too many physical branches or even ATMs and credit cards. Kotak Mahindra, for example, has launched an 811 account where you can open an account through an app in five minutes, if you can quote your Aadhaar number and Pan. This app hosts your debit card and enables e-payments to almost anybody. As for telecom, with the entry of Reliance’s Jio, a fully-internet protocol-based mobile service, voice calls have become free and data costs are crashing. This has forced a consolidation in the industry, with Airtel buying out Telenor, Reliance Communications merging with Sistema and Aircel, and Vodafone merging with Idea Cellular. Mergers invariably mean more shared services and shedding of jobs in the merged entity. But the biggest threat to white collar jobs is, by far, automation, with robots taking over factories and even service jobs that are routine.

Put another way, manufacturing is making a comeback in high-cost advanced nation, but it will be creating even fewer jobs than before. This trend is being accentuated by the world’s huge surpluses in capital. According to one report, US corporations held more than $2.6 trillion in untaxed cash offshore. With companies like Apple and Google holding hoards of cash, they are investing even more in cutting-edge technologies like driverless cars and other types of automation that will eat further into jobs. This is not to say that jobs will not be created, but they will be created more downstream, in sales, servicing and consumer tracking. Meanwhile, manufacturing and services companies are hiring people on a contractual basis – jobs that offer low security of service and few long-term benefits.What we are now facing is not necessarily the diminution of jobs, but the decimation of jobs that people would want for themselves.Jobs quality is going to be the first victim, and the new jobs market will have a handful of people with high skills making money hand over fist, and a mass of people with uncertain and poor quality jobs.

This is what the jobs crisis will really be about

Read More

https://swarajyamag.com/business/middle-class-shock-good-quality-jobs-are-vanishing-in-it-finance-and-telecom

Online food delivery growth at 30% last year

Online food delivery in India grew at a staggering pace to reach USD 300 Million in GMV terms in 2016 with food delivery players handling on an average 1,60,000 orders in a day with average order value of Rs 300. The numbers are not big enough to stop the bleeding happening in food startup space in India’s with companies shuttering and downsizing and food tech investments plunging from $500 million in 2015 to $80 million in 2016. However, restaurants and customers have been embracing online food-ordering.

Overall, the restaurant industry in India grew 11% from 2015 to 2016 but was far outpaced by food delivery’s 30% figure in the same period, according to a 2017 RedSeer report. Although this includes all delivery orders placed from the expanding online food-delivery market. Major factors driving the growth in delivery are Changing consumer lifestyle, Young population, increasing disposable income and Greater share of women in workforce Compared to other countries, online-delivery penetration in India is minuscule. Just 2% of all restaurant delivery orders in India are made online, compared to 11% in China, 13% in the US, and 32% in the UK, according to RedSeer. The firm believes the UK is a mature market while the US and China are in a period of stable growth. Indian online food delivery, meanwhile, is still in its infancy.

Read More

https://www.dropbox.com/s/5w4mr4tghlyxwdg/Food%20Tech_Market%20Perspective_2016_v1.pdf?dl=0

Here’s How 5 Tech Giants Make Their Billions

The Revenue Streams of the Five Largest Tech Companies

tech companies have displaced traditional blue chip companies like Exxon Mobil and Walmart as the most valuable companies in the world.

Here are the latest market valuations for those same five companies:

Rank Company Market Cap (Billions, as of May 11, 2017) Primary Revenue Driver
#1 Apple $804 Hardware
#2 Alphabet $651 Advertising
#3 Microsoft $536 Software
#4 Amazon $455 Online Retail
#5 Facebook $434 Advertising
TOTAL $2,880

Together, they are worth $2.9 trillion in market capitalization ( more than india’s GDP)  – and they combined in FY2016 for revenues of $555 billion with a $94 billion bottom line.

BRINGING HOME THE BACON?

Despite all being at the top of the stock market food chain, the companies are at very different stages.

In 2016, Apple experienced its first annual revenue decline since 2001, but the company brought home a profit equal to that of all other four companies combined.

On the other hand, Amazon is becoming a revenue machine with very little margin, while Facebook generates 5x more profit despite far smaller top line numbers.

Company 2016 Revenue (Billions) 2016 Net Income (Billions) Margin
Apple $216 $46 21%
Alphabet $90 $19 21%
Microsoft $85 $17 20%
Amazon $136 $2 2%
Facebook $28 $10 36%

HOW THEY MAKE THEIR BILLIONS

Each of these companies is pretty unique in how they generate revenue, though there is some overlap:

  • Facebook and Alphabet each make the vast majority of their revenues from advertising (97% and 88%, respectively)
  • Apple makes 63% of their revenue from the iPhone, and another 21% coming from the iPad and Mac lines
  • Amazon makes 90% from its “Product” and “Media” categories, and 9% from AWS
  • Microsoft is diverse: Office (28%), servers (22%), Xbox (11%), Windows (9%), ads (7%), Surface (5%), and other (18%)

Lastly, for fun, what if we added all these companies’ revenues together, and categorized them by source?

Category 2016 Revenue (Millions) % Total Description
Hardware $197,020 36% iPhone, iPad, Mac, Xbox, Surface
Online Retail $122,205 22% Amazon (Product and Media Categories)
Advertising $112,366 20% Google, Facebook, YouTube, Bing ads
Software $31,692 6% Office, Windows
Cloud/Server $31,396 6% AWS, Microsoft Server, Azure
Other $60,177 11% Consulting, other services (iTunes, Google Play), etc.
$554,856 100%

Note: this isn’t perfect. As an example, Amazon’s fast-growing advertising business gets lumped into their “Other” category.

Hardware, e-commerce, and and advertising make up 76% of all revenues.

Meanwhile, software isn’t the cash cow it used to be, but it does help serve as a means to an end for some companies. For example, Android doesn’t generate any revenue directly, but it does allow more users to buy apps in the Play Store and to search Google via their mobile devices. Likewise, Apple bundles in operating systems with each hardware purchase.

Stretched sentiment shrinking liquidity

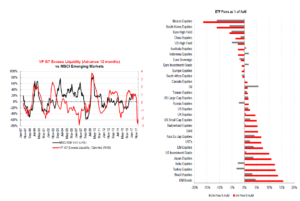
Indian Equities have been recepient of both local ( MF inflows) and global ETF liquidity.India dedicated ETF have been one of the largest recepient of this liquidity( refer to the chart).  Global liquidity has been deteriorating for last 1 month and if MF inflows continue unabated then we might see markets atleast stalling and catching its breath for some time .

Variant Perceptions writes that “Liquidity conditions have deteriorated meaningfully for EM equities. The left chart below shows that the steep drop in G7 Excess Liquidity points to a risk of much lower EM equity prices in about 3-4 months’ time.This materially worse backdrop for EM equities is happening just when investors are piling into EM assets. If we look at the chart on the right, we can see that EM bonds and equities are seeing the largest ETF inflows over the last three months. Although, we are selectively positive on some specific EM markets (such as Malaysia), overall we believe investors should rotate away from broad EM equities exposure”.

https://blog.variantperception.com/2017/05/12/stretched-sentiment-leaves-em-vulnerable/


Jeremy Grantham on why “This time is different”

This time it’s some of the most respected minds in the world propagating theories of a “new era” for risk assets. Jeremy Grantham recently wrote a piece arguing that both equity valuations and profit margins have possibly reached a new, higher plateau:

Jeremy Grantham on why stock prices can remain high..

So, to summarize, stock prices are held up by abnormal profit margins, which in turn are produced mainly by lower real rates, the benefits of which are not competed away because of increased monopoly power, etc. What, we might ask, will it take to break this chain? Any answer, I think, must start with an increase in real rates . Last fall, a hundred other commentators and I offered many reasons for the lower rates. The problem for explaining or predicting future higher rates is that all the influences on rates seem long term or even very long term. One of the most plausible reasons, for example, is the aging of the populations of the developed world and China, which produces more desperate 50-yearolds saving for retirement and fewer 30-year-olds spending everything they earn or can borrow. This results, on the margin, in a lowered demand for capital and hence lower real rates. We can probably agree that this reason will take a few decades to fade away, not the usual seven-year average regression period for financial ratios.
Any effect of lower population growth rates is likely to take even longer. No one seems sure what is causing lower productivity growth or what role it has in lower rates, but it would take some very unexpected good fortune to have productivity accelerate enough to drive rates upward in the near term. Income inequality that may be helping to keep growth and rates lower will, unfortunately, in my opinion, also take decades to move materially unless we have a very unexpected near revolution in politics.


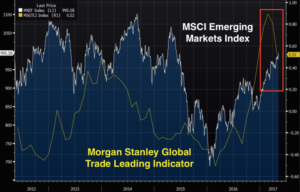
This leading indicator just ring the bell for Emerging markets

Gary writes that The following set of circumstances are probably a recipe for market reversal (atleast it used to be)

1.tightening in China
2.Chinese econ rolling over
3.plunging commodities
4.EM priced to perfection
That fourth point is critical.

EM has already shaken off the beginning of what’s supposed to be a Fed tightening cycle and EM equities have recently decoupled from commodities.

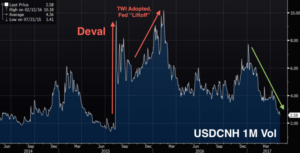
So the obvious question is how many more bullets can a priced-to-perfection EM complex deflect? There’s certainly an argument to be made that the only thing keeping this thing from going off the rails is a stable yuan ( like every other market even chinese yuan volatility has just collapsed)


But stepping back from the recent commodities carnage, metals mayhem, and Chinese econ data, there’s a kind of  argument for why EM could soon stumble upon its day of reckoning. Have a look at this:


Simply put, if that is indeed the “leading indicator” it’s billed to be, then history tells us that Emerging market rally probably is due for a much needed correction .

Who Holds U.S. Debt Internationally

U.S. Federal Government has roughly $20 trillion of debt ( roughly 10 times India GDP).  who exactly owns all these treasuries?

DEBT HELD BY THE PUBLIC

“Debt held by the public” is the most interesting of these, and it can be further broken down:

Entity U.S. Debt Held (Billions)
Foreign/International $6,154.9
Federal Reserve* $2,490.6

Here’s how that breaks down by country:

Country U.S. Debt Held (Billions)
Japan $1,090.8
China $1,058.4
Ireland $288.2
Cayman Islands $263.5
Brazil $259.2
Switzerland $229.9
Luxembourg $223.4
United Kingdom $217.1
Hong Kong $191.4
Taiwan $189.3
India $118.2
Saudi Arabia $102.8
Others $1,771.7

Note: This data is from December 2016


Why is RBI becoming Hawkish?

Inflation is under control, Currency is well behaved, credit growth at multi year low . “The MPC minutes revealed RBI executive director Michael Patra was of the view a pre-emptive 25-basis-point hike in the policy rate was required to prevent the need for ‘back-loaded’ policy action once inflation was already too high. “The minutes of the RBI’s 6 April policy meeting suggest that the next move will likely be a hike, as highlighted by two MPC members,” Nomura economist Sonal Varma wrote”

I have an alternative explanation for RBI turning hawkish and I think the clue to that lies in the following report

J.P. Morgan is offering regional banks some interesting advice:  Partner Up as U.S. Deposit Drain Looms.

JPMorgan Chase & Co. has some advice for regional banks: A deposit drain is coming,

The company’s investment bankers are warning depository clients that they may begin feeling the crunch in December, thanks to a byproduct of how the U.S. Federal Reserve propped up the economy after the financial crisis, according to a copy of a confidential presentation obtained by Bloomberg News and confirmed by a JPMorgan spokesman.

JPMorgan argues that some midsize U.S. banks —  could face a funding problem in coming years as the Fed goes about shrinking its massive balance sheet, according to the 19-page report the New York-based bank has begun sharing with clients.

The Fed is currently holding about $4.5 trillion of securities. The way it will get rid of them is by letting them mature and not buying new ones.

(my view…..the same advice holds true for all emerging countries because QE and reinvesting proceeds by US FED is single biggest reason for flow into Emerging markets including India)

Deposit ‘Destroyed’

JPMorgan’s presentation, titled “Core Deposits Strike Back” illustrates how this process will sap bank deposits using the example of a couple who pays off a mortgage that was bundled with other mortgages and sold to the Fed. Right now, when that couple takes that money out of their bank account for that payment, the Fed uses that cash to buy another mortgage bond, recycling it back into the banking system.

A “deposit is destroyed” if the “Fed does not reinvest,” the presentation states. and that is what FED intends to do “shrinking FED balancesheet”

Midsize banks will have an especially hard time growing retail deposits by ramping up advertising and investing in branches, according to JPMorgan’s presentation. That’s because they lack the marketing muscle of mega banks such as JPMorgan itself, as well as Wells Fargo & Co., Citigroup Inc., and Bank of America Corp.( my view ……swap midsize banks with EM central banks which does not have sufficiently high interest rate differentials over US rate).

The FED rate tightening itself is not a big deal because it only increases the cost of Liquidity marginally but more importantly LIQUIDITY stays ithe system. Most crisis happens when Liquidity is not available, not when cost of liquidity is going up.US Dollar is the reserve currency of world and the largesse by FED ( in the form of QE and reinvesting the maturing proceds back into market instruments) has allowed liquidity to flow outside US borders into any asset deemed attractive including EM bonds and equities. Now FED is telegraphing its intent to remove liquidity and i think this removal of liquidity is the more important consideration in RBI becoming hawkish and preempting FED by preparing market for a rate hike.


America’s favourite brand …..and Apple is not one of them

Amazon CEO Jeff Bezos once said: “If you make customers unhappy in the physical world, they might each tell 6 friends. If you make customers unhappy on the Internet, they can each tell 6,000 friends.” As the infographic below shows, the founder of ‘earth’s biggest bookstore’ certainly seems to have kept this wisdom in mind, building his company into the ‘most loved’ brand in the United States.

A recent survey by Morning Consult revealed that Amazon currently enjoys a nationwide-best net favorability of 76 percent. Close behind the Seattle-based retail giant is Google, with a 75 percent score. The top ten is dominated by American companies, with one exception; Japanese tech firm Sony makes it into joint eigtth position with Home Depot and Lowe’s with 70 percent.