Delusional outlook

There is a presumption that faster economic growth in emerging markets drive up corporate earnings as well. This statement isn’t new. Many “supply-side” models of stock market returns are based on macroeconomic performance.

Supply side models assume that the GDP growth of underlying economy flows to shareholders in three steps:

  1. It transforms into corporate profit growth
  2. The aggregate earnings growth translates into EPS growth
  3. EPS growth translates into stock price increases

The thought of high GDP growth in EM’s lead to faster EPS now seems intuitive but in practice research shows contradictory results. See the chart below,EPS has grown at a slower pace than GDP.

In reality, firstly, we need to expand our view to global markets than local markets. With globalisation operations is distributed throughout the world and production processes for these MNC’s is not reflected in country’s GDP. Company’s revenue and share price largely depend on global GDP growth as increasing proportion of products is sold abroad.

Secondly, a significant part of economic growth comes from new enterprises and not by faster growth of existing ones.

In EM’s the finance and resources sectors account for a far larger portion of the stock exchange them they do of domestic corporate sector. Dilution from equity issuance has been far greater in EM’s than in developed ones. Research by Schroders over 10 years to 2017 estimates the dilution across all EM’s at 3.8% p.a. on average, significantly larger than 0.5% p.a. dilution for DM’s.

Rather than dilution, across portfolio most companies have reduced shares on issue, so EPS has risen faster than profits. EPS dilution arising from growth in issued shares is greater than the lower the return on capital. This causes discrepancy between corporate earnings and earnings per share. If companies issue new shares and dilute existing shareholders or if young companies go public, capital increases and the economy grows, but shareholders are not receiving any increase in EPS. In such case, the market capitalization grow much more than shareholders’ returns.

India for example, shows divergence in corporate earnings and GDP growth. As per Aoris Investment Management report on Emerging Market Fallacy, “The profits of all listed and unlisted companies relative to GDP in India declined from a peak of 7.8% in 2008 to 3% in 2018. Over that period, India’s nominal GDP (including inflation) grew at a rate of 12.90% while earnings of Indian companies grew by just 2.6% p.a.”

In few analysis, it is evident that long term equity performance was similar to GDP growth. However, this parallel growth was due to increasing valuations offsetting the dilution effect. Expected economic growth is built into current prices, thus reducing future realized returns. As an example, when Japan’s Nikkei 225 soared to almost 39,000 in late December 1989, investors were bullish about the growth of Japanese economy. When the expected growth did not happen, the stock markets collapsed.

Mobilizing domestic resources is not simply a matter of taxing more, it’s also about taxing better, by expanding the tax base, ensuring an appropriate distribution of the tax burden among taxpayers, simplifying and improving the efficiency of tax administration, bringing tax laws up to date, and making sure that tax administrators know how to audit local and multinational companies alike. The citizenry must see the tax system as being equitable. There is a concern that the trend toward lower taxation of capital (to encourage growth) is making it harder to counter the growing inequality of income and wealth. The growing income and wealth gaps can undermine social cohesion, and ultimately undermine economic growth as well. World Bank flagship report states, “EMDE activity has stalled, in part reflecting the effect of financial stress in some large economies with sizable current account deficits and high exposure to volatile capital flows. Domestic demand across EMDEs has generally moderated and trade flows have softened. High – frequency indicators suggest that the weakness continues, particularly in vulnerable economies.”

Country – specific sectors influence a country’s ability to attract long term financing. Development of domestic capital markets to act as a long term source of financing will support the goal of strong, sustainable and balanced growth. This calls for greater attention to policies and instruments that can lower the risk and strengthen the confidence of investors over a long term horizon.  Domestic resource mobilization is always going to be a main source of funding for development purposes. 

Gaps between investment needs and the availability of appropriate financing often arise not only from the supply side of financing, but also as a result of a weak underlying investment climate, lack of planning and institutional capacity, and the absence of strong regulatory frameworks.

As per FSD report, “GDP growth is expected to remain steady at 3.0% in 2019 and 2020. Most growth forecasts have been revised downwards due in part to the negative effects of trade uncertainty and weakening financial market sentiment.

In current uncertain environment, financial markets are highly susceptible to a sudden shift in investors’ perception of market risk which could result in a sharp and disorderly tightening of global financial conditions. A faster than expected pace of increasing interest rates in systemically important developed economies could have significant spillover effects on the rest of the world, including sharp reversal of capital flows from developing countries. This would likely have a larger impact on countries with weak macroeconomic fundamentals, large external imbalances, high indebtedness and a high share of short term liabilities among capital inflows and low policy buffers. Currency depreciation can also dampen capital investment through balance sheet effects.”

In Conclusion “EPS growth in EM’s has fallen significantly short of GDP growth over the last decade. You may feel bullish on the Chinese economy or the recovery prospects in Brazil. However, counterintuitive though this may feel, your view on an economy should have no bearing on your expectation for EPS growth from that particular country.”

file:///C:/Users/rites/Desktop/The%20Emerging%20Market%20fallacy.pdf
June 2019 IceCap Global Outlook – “Threading the Needle”

This one is MUST READ for all serious investors. A HIGH TIDE is coming and it is going to sweep most assets except US Dollar.

For many, the investment world can be a confusing place. Banks, mutual finds, stocks, bonds, currencies, insurance, inflation, taxes, economies – it’s no wonder the majority have glossed eyes.

And sitting on top of this confusion pie are central banks.

Each country has its own central bank which is responsible for setting overnight interest rates and the amount of money in that country’s financial system.

Yet, there is one central bank that is the most important, sits on top of the world, and all of its actions impact not only their local country, but also every other country in the world.

This central bank is the US Federal Reserve.

In this latest IceCap Global Outlook we share how actions by the US Federal Reserve are always reactive to a crisis which, ironically, it helped create in the first place.

Today’s central banks are once again, trying to thread the financial needle, and rescue us from the crisis that was born from the depths of the 2008-09 Great Financial Crisis.

The crisis is happening, yet there is good news – the crisis is creating opportunities to not only preserve your hard earned savings, but to capitalize too.

http://icecapassetmanagement.com/wp-content/uploads/2019/06/2019.06-IceCap-Global-Outlook.pdf

Gold & the Hedge against Government

Martin writes in his blog

The only time gold has rallied significantly is when the CONFIDENCE in government declines. That was the case during the post-1976 era for people saw inflation as running away. That was because of OPEC creating STAGFLATION meaning it was cost-push inflation that eventually converted to demand-push inflation by mid-1979. I understand that all of these gold-bug analysts have been preaching hyperinflation for decades. The whole Quantitative Easing (QE) was supposed to create $10,000 gold years ago. Here, after 10 years of QE, gold remains trapped in a consolidation.

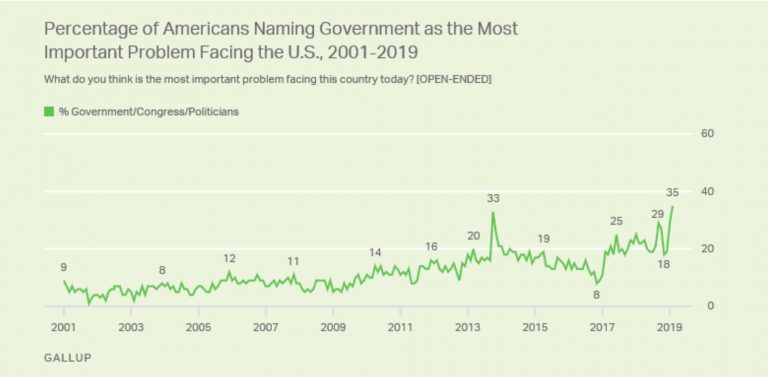
Gold will be the hedge against political uncertainty and government ONLY when the people reach that critical point of losing faith in government. We are at the 35% level where people believe the government is the number one problem. When that crosses the 45% mark, things will start to become different. This has nothing to do with the quantity of money. Most millennials use their phones to buy things or credit cards – not cash. The idea of gold as a store of value has faded between generations. The worst thing you could do is judge the world by what you believe. Everyone will act only on their own reasoning and belief system.

IN GOLD WE TRUST!

By Apra Sharma

Money is most vulnerable to level of public trust. Federal Reserve under Paul Volcker restored confidence through a restrictive monetary policy that led to high interest rates which is still unparalleled today. In 2008 – 09, the tides turned as global credit crisis eroded confidence which was intact since 1980s.

As monetary asset, gold can look back on asuccessful five-thousand-year history in which it was able to maintain its purchasing power over long periods of time and never became worthless. Gold is the universal reserve asset to which central banks, investors, and private individuals from every corner of the world and of every religion and every class return again and again.

The steady buying of gold and the repatriation of central bank gold clearly indicate growing mutual distrust among central banks. An example is the recent tenfold increase in the Hungarian gold stock. The official announcement of the Hungarian central bank on its first gold purchases since 1986 states: “In normal circumstances, gold has a confidence-building feature, i.e. it may play a stabilising role and act as a major line of defence under extreme market conditions or in times of structural changes in the international financial system or deep geopolitical crises. In addition, gold continues to be one of the safest assets, which can be related to individual properties such as the limited supply of physical precious metal, which is not linked with credit or counterparty risk, given that gold is not a claim on a specific counterparty or country.”

Commodities remain the exception and still do not participate in the ‘everything bubble’. The extreme relative undervaluation of commodities compared to the stock market becomes evident in the next chart.

As long as the equity market party continues, trust in the credit-financed growth model seems intact. But how sustainable is such an upswing?Popular trust in the idea that monetary policies can sustain growth and employment and that central banks have inflation under control will be seriously tested in the next recession.

In terms of performance, USD terms gold generated an unsatisfactory return in 2018, declining by 2.1%, while it gained 2.7% in euro terms.

The world gold price is now not too far from its October 2012 high of 1,836 USD (monthly average). Spread between world gold price and the gold price in US dollars has tightened since 2017.

2018 as a whole was positive for gold in most world currencies. Only the (supposed) safe-haven currencies (USD, CHF, JPY) recorded (slight) losses. The average performance in this secular bull market remains impressive. The average annual performance 2001 to now is 9.1%. Despite significant corrections, gold was able to outperform virtually every other asset class and above all every other currency during this period. Since the beginning of 2019, the development has been relatively unspectacular. The average plus is 0.8%.

The chart also provides impressive evidence that it is advisable to regularly accumulate gold (“gold saving”) by harnessing the cost-average effect.

A strong US dollar does much less damage to the gold price than a weak US dollar does to gold. Gold always moves out of countries whose capital stock is declining and flows into countries where capital accumulation is taking place, the economy is prospering, and the volume of savings is increasing.

However, it appears that signals of a US recession are slowly increasing. The Federal Reserve’s recession indicator currently indicates a recession probability of 27.5% for April 2020.

The S&P 500 was comfortable at 9% in the first three quarters of 2018, before a sell-off started in October and culminated in December emerging as its weakest performance since the Great Depression. This seems particularly significant as Q4 usually has the best seasonal performance. On a sector basis, only 7 of the 121 industry groups in the S&P 500 reported positive performance. At the top: gold mining stocks gained 13.71%!

This comparison clearly confirms gold (and mining stocks) as a portfolio stabilizer.Gold performed poorly compared to the S&P 500 in those years when the S&P posted very high gains. Gold, on the other hand, recorded the highest relative gains compared with the S&P in those years in which the S&P did poorly – with the exception of the special year 1979.

Rising inflation rates generally mean a positive environment for the gold price, while falling but positive rates (disinflation) represent a negative environment. Rising price inflation coupled with mounting economic risks would probably mean the perfect storm for gold: stagflation. At the moment, however, the consensus view is that this seems an almost impossible scenario.

Like any price, the price of gold depends on the assessments of market participants. Gold, in its capacity as a hedge against crises oftrust is directly dependent on the level of public trust. The value of the US Treasury’s gold holdings has historically traded in a band between 20 and 140 percent of the monetary base. Currently, the percentage stands at 9%, which clearly indicates an extreme undervaluation of gold. If you look at the gold bull markets of the last 50 years, you can see that even in its weakest upward period, gold was able to gain 71%.

Technical analysis shows that the impulsive rise from USD 280 to USD 1,920 has been corrected since 2011. As part of this corrective movement, an impressive inverse shoulder-head-shoulder formation has been forming since 2013, which could explosively resolve upwards.Currently, however, the price has already failed several times on the neck line in the resistance range of USD 1,360-1,400. If the gold price were to break through this resistance zone, the next target would be almost USD 1,800, as calculated on the basis of the distance from the head to the shoulder line, projected upwards.

A rising stock market usually goes hand in hand with a falling gold/silver ratio, i.e. an outperformance of silver compared to gold. However, in 2012 this correlation broke down.

The silver price could also be interpreted as a sentiment indicator for gold.Strong bull markets for silver usually only happen in the course of risinggold prices, because investors seek higher leverage and end up with mining stocksor silver. With the gold movement still meandering, silver is likely to wait for thenext breakout attempt of the gold price before gaining trend strength and relativestrength to gold. The ratio of 88 clearly shows that sentiment in the precious metals space is currently at rock bottom.

The above chart shows that the G/S ratio is subject to large fluctuations over time. Around 1980 we can see a low point at a ratio of 16, while in 1991 it almost reached the 100 mark. At the moment, it seems that the ratio wants to test the highs from 2008 at around 87. The risk of price declines appears to be limited at this historically extreme relative valuation.However, silver remains dependent on the price movements of gold, and bullish momentum seems unlikely in the medium term.

The past 12 months have shown that the seemingly invulnerable economic upswing has begun to crack deeply.The worldwide boom, driven by low interest rates and a ceaseless expansion of credit and money, now stands on feet of clay.  In our opinion, the currentlyhigh trust granted into the skills of central bankers and the supposed strength ofthe US economy are the main reasons for the somewhat weak development of theyellow metal. If the omnipotence of the central banks or the credit-driven recordupswing are called into question by the markets, this will herald a fundamental change in global patterns of thinking and help gold to old honours and new heights.

https://ingoldwetrust.report/igwt/?lang=en

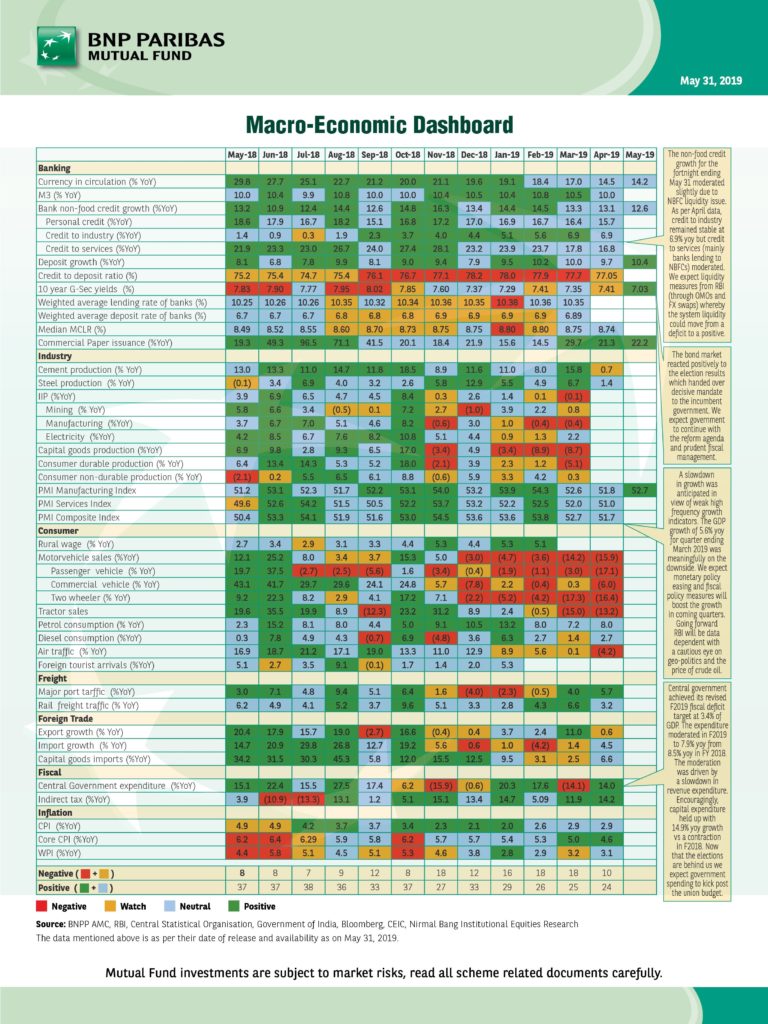
India Macro Economic Dashboard

Key highlights of the fortnight:

The non-food credit growth for the fortnight ending May 31 moderated slightly due to NBFC liquidity issue. As per April data, credit to industry remained stable at 6.9% yoy but credit to services (mainly banks lending to NBFCs) moderated. We expect liquidity measures from RBI (through OMOs and FX swaps) whereby the system liquidity could move from a deficit to a positive

The bond market reacted positively to the election results which handed over decisive mandate to the incumbent government. We expect government to continue with the reform agenda and prudent fiscal management.A slowdown in growth was anticipated in view of weak high frequency growth indicators. The GDP growth of 5.6% yoy for quarter ending March 2019 was meaningfully on the downside. We expect monetary policy easing and fiscal policy measures will boost the growth in coming quarters. Going forward RBI will be data dependent with a cautious eye on geo-politics and the price of crude oil

Central government achieved its revised F2019 fiscal deficit target at 3.4% of GDP. The expenditure moderated in F2019 to 7.9% yoy from 8.5% yoy in FY 2018. The moderation was driven by a slowdown in revenue expenditure.Encouragingly, capital expenditure held up with 14.9% yoy growth vs a contraction in F2018. Now that the elections are behind us we expect government spending to kick start post the union budget.

The next Recession

The US payroll data came out today and it was bad. Although Jobless rate is still respectable at 3.6% the new Job creation has virtually come to a halt. Markets are now pricing three FED rate cuts this year with some investment bankers sticking their neck out for a rate cut as early as this month. In LIGHT of weakening US data I thought I should put down some thoughts on “ The next recession”

The next recession

DoubleLine Capital CEO Jeffrey Gundlach held a recent webcast with investors in which the self-described “Bond King” said U.S. GDP growth relies almost “exclusively” on rising government, corporate and mortgage debt, and there is a 50% chance the economy sinks into recession in the next year. “Nominal GDP growth over the past five years would have been negative if U.S. public debt had not increased,” Gundlach said. Over the past five years, the nominal GDP grew by 4.3%, while public debt grew by 4.7%, higher than the entire country’s GDP.

Condition Comparison

Conditions today are radically different than in 2007 and 2000.

The Fed re-blew a housing price bubble but the number of jobs tied to construction, sales, CDOs, agents and even the impact on banks is a shell of what happened in previous recession.Technology is bubbly, but not like 2000.

Just like subprime mortgage debt triggered the last recession, in my view corporate debt will trigger the next one. This may start a liquidity crisis and create havoc in all sorts of “unrelated” markets.

The chart below explains the weakening credit profile of US corporate sector.

Few Pointers on Impact

  1. We will not have bank failures in the US although Canadian Banks balance sheet are relatively weaker and are more tied to housing markets than ever before.
  2. There will be major bank failures or bail-ins in Europe with Deutsche Bank being the frontrunner to fail. Its stock price has collapsed 40% in last one year
  3. Housing will not have a major role but may strengthen the recession.
  4. Millennials simply cannot afford houses so housing will not lead a Fed attempt at a recovery even if interest rates plunge.
  5. Low interest rates and easy LIQUIDITY will keep zombie companies alive for a while longer. This problem is more acute in Europe or China than US
  6. Recession always bring higher unemployment, on top of technology-driven job losses.
  7. Retail sales will plunge because consumer debt is at an all time high
  8. The impact of the above is very weak profits but not massive labor disruption
  9. Stocks will get clobbered as earnings take a huge hit.
  10. Junk bonds also get clobbered on fears of rolling over debt.
  11. This malaise can potentially last for years unlike previous two recessions where central bankers had dry powder to bring back growth.

New tools to counter next recession

There is also a new economic theory taking shape to fight next recession i.e “MMT” Modern Monetary Theory. This theory talks about increasing government spending to fight the next recession but with a twist that all government borrowing will be funded by Central Bank printing (effectively creating money out of thin air). This radical step is already being discussed among economist because traditional monetary easing has failed in either lifting GDP or Inflation.

India’s Economic Winter is not over

Albert Edwards Ice Age theory for US and Rohit ” India’s Economic Winter is not over” are not too different. I have myself studied Kondratieff winter and believe there is no way to avoid it.

Rohit writes in Indiacharts

After writing the Modi bubble 2.0, I have some skeptics now, and with good reason. A strong government should be able to solve all our problems. Last week I sent out a very deep interview with two men from the debt markets and I hope you watched it. It touched upon everything that is going on without bias. Even as I do not speak there on the topics that interest me. Here are links to the two part interview

Back to the point it was not more than a week ago that Anil Ambani was quoted in the ET stating that India’s NBFC sector was in the ICU and needed more than just a pain killer. And you still doubt that we are in an economic winter? The reason for doubt only comes from looking at the Nifty. But maybe also because we are in an unusual period of time, one that you will only experience once in your lifetime. 

The Kondratieff cycle is a generational cycle so you will go through this season only once in your life. And since you did not live in the last one there is no reference point. As a student of the cycle I use it to forecast economic events that will follow. But I have no past experience of it and cannot because the last time this may have happened was 70-100 years ago. So while an Economic Autumn is a bull market in consumption aided by cheap credit, an economic winter is the unwinding of over indebtedness of an entire society. The level at which these extremes ar reached is not fixed.

IMG 20190606 095723

So while most will consider my winter call as a perma-bearish stance they will miss out on the utility of that view in asset allocation. I have found my niche in commodities and related sectors in this time.

That said it does not change that our non government debt/gdp ratio is over 100%. This is big by any standard. Getting the economy to then grow requires an ever increasing stimulus of new money. The reason why the market faces a dilemma in accepting the winter theory is that for some reason the Autumn cycle of consumption and the unwinding of debt ended up happening at the same time. So it is a tug of war between two worlds. The indices were restructured in good time to reflect the upside from growth sectors. The government did its bit by using OMOs, the pay commission, MSPs, and low interest rates with demonetisation, to allow the ever expanding pent up demand in consumption to exhaust itself.

Did I say exhaust? I mean there is a limit to how many cars I can buy. After 2 by the time I think of a third orr a switch to the latest model maybe my kids grew up and their education expenses took a front row seat. How many biscuits can you consume. You should know that the largest margin expansion in FMCG comes from the contribution margin which is price increases. In the late 90s the same companies suffered from down pricing. But eventually the inflation cycle kicked in and profits exploded. But inflation is also a cycle and there is a limit.  No wonder that today post elections on the first RBI meet expectations are built in for a 50bps rate cut to save the nation. But will the additional savings translate into consumption? In the para above note that I brought a demographic angle into the discussion. Unfortunately we do not have data on all fronts in India else it should be easy to map it. Demographics change the consumption behaviour of a generation. The same generation that was buying homes and second homes will now find other uses for their money. Maybe retirement planning and education for their kids.

In the meantime this does nothing for our debt burden sitting on bank balance sheets. If RBI had not pushed it in 2015, till 2014 nobody even agreed with me that we had an NPA problem. Then NBFCs were the hottest sector. Even today some analysts in media believe that the NBFC crisis this time cannot be compared to that of the 1990s. Yes it cannot, exactly. It is different but it is not small. In fact my sense is that we are only skimming the surface. As below the government knows it. In fact this piece below sounds like we are discussing the Lehman crisis. Who is too big to fail? But Lehman was the one let go.

IMG 20190606 072714

The reason I posted the video links above is for you to understand the inter linkages that exist in the financial sector. Contagion is a word that is real. One one firm fails it has a multiplier effect. And they it is game over. The negative sentiment on investment flows can quickly suck up liquidity from the system. For long this was debated with ILFS and banks were not marking it down as bad debt.

The side effects are still a work in progress like below.

IMG 20190606 071955a


But the real talk of town today is DHFL, a payment delay at the lender followed by a debt downgrade has suddenly made its NCDs marked down and illiquid.

IMG 20190606 083916

Meaning that a lot of mutual funds that hold debt from the lender have to mark it down and face losses. And if that gets followed by redemption pressures it will be something to watch on how the demands are fulfilled. If this is not contagion what is

All this while growth in key sectors like Autos have finally hit the wall.

Domestic Auto Sales Slowing

And Scooters

Another angle to the story is that overconsumption has lead to a drop in the savings rate. The side effect of that has been a spike in the credit deposit ratio. In the video above “Ananth” mentioned it to be well above 100%. With that we are still asking for credit growth to pick up and the panacea is supposed to be lower interest rates? Like that will push up savings. Macro economic factors are a complex matrix. For every pro there is a con. And we can play with the numbers as long as we can but at some point of time we have to face the old adage of “Mean Reversion”

And let me end by saying that many trends are global, the fall in Auto sales is now a worldwide phenomena over the last 2 years. And the negative impact of the NBFC crisis is seen in rising bond market spreads both in India,

India Spread chart

and likely in the US, for completely different reasons. An earnings recession at a time when wage inflation is eating into margins. Hitting profit growth and thus raising risk for high yields debt. Its funny whether you like it or not many of the trends we witness now days are global.

I am well aware that everything I am writing here is the negative side of the story. A new strong government at the helm. A 100,000 crore spending plan and a 50-75bps rate cut is going to solve all our problems in the months ahead. That keeps the tug of war between the Autumn and Winter cycles going on a little longer. There is only one thing I can tell you with certainty. Winter always follows the Autumn and not the other way around. You can push it but just this far. My warnings about the debt cycle have proven true over the last 10 years even as markets have risen, this has shown up in every debt crisis one after the other during this time. That gives me no reason to discard the theory or the anticipation of what lies next. I think we will go from one NBFC to the Dirty Dozen pretty soon, and not necessary that all are listed entities. This keeps me on my toes for what follows and in search of the right opportunities for these confusing times. This is not a time cycle that you can put a date upon. It is a cycle of events that follow one another no matter how slowly they do so. The economic winter in India is real be aware and prepared, An economic slowdown would exacerbate the problems and bring more skeletons out of the cupboard. It is in the interest of the government to keep that from happening. But we are pushing on a string. You can spend too much and trigger higher interest rates or inflation. It is going to be a tight rope walk and hoping that the wind does not blow.

My two cents

I completely agree with Rohit assessment and India is getting into debt trap which policy makers are not even noticing. The tools applied by G-7 central bankers did not add GDP but added indebtedness with financial markets as the main beneficiary. This only widened the gap between Rich and Poor. It is naïve to believe that the same tools of monetary easing will work in India. We have postponed our problems for so long that they are no more cyclical but have become structural . There are two choices in front of India, either rapidly devalue the currency and inflate away the debt ( which US might not allow this time) or create conditions for attracting foreign capital to fund the countries infrastructure which will ultimately grease the economic wheel.


Yield Curve Collapse Signaling Warning Signs

by Capital Trading Group | Jun 4, 2019

Let’s dig into a few things that are piquing our interest this week. We feel that investors need to be fully aware and cognizant of the investment landscape that is currently controlled by the global central banks. The recent bout of economic volatility should be here to stay as the Federal Reserve shifts its tightening campaign and reverses its course rather quickly over the coming months. Speaking of the Federal Reserve they are meeting this week in Chicago to review current monetary policy. As this Bloomberg article points out, the Fed and group of academics get together to discuss new research and complex topics. Well one thing will be certain, whatever they come up with will be well behind the curve and as the past has consistently proven, the FED and their 700 PhD’s are chalk full of terrible prognostication capabilities.

In fact we have this chart here just to show you how severe the 360 degree change has been over the last few months as all the quants that were predicting Fed continued tightening which was expecting nearly 80 basis points of tightening at the end of last year, to now calling for 50 basis points of easing. With this newly found trajectory this chart points out the over exuberance of the SP500 market in comparison to the new expected path of lower rates. Who said markets are efficient, BS we know better? Basically, the question becomes, do you believe the bond markets or the equity markets right now??? We know where we stand!

Easing Priced

Read Full post below

http://blog.capitaltradinggroup.com/yield-curve-collapse-signaling-warning-signs?hs_amp=true&__twitter_impression=true

Memo to Powell:

Bill Blain’s Morning porridge

Dear Chairman

The Stock Market is not a driver of growth – it is the price investors are willing to pay for their perceptions of future value of stock market assets, a price which is relative to other assets, including factories, property, intellectual capital and infrastructure. Do not confuse the stock market with the economy. “Trade war” weakness may worry investors about the value of their stocks, but, should equally cause investors to finance and build new economic assets (ie factories, farms, infrastructure, schools, etc) to benefit from the opportunities “trade war” opens long term to the US economy.

While reducing rates to near zero levels to finance a Trade War with China may seem a logical decision, experience shows the unintended consequences of zero rates will achieve sub-optimal results. Since 2009 “lower for longer” rates have not caused a regeneration of manufacturing, infrastructure or other productive assets. Instead, low rates have encouraged corporates to buy back their own stock, pay their owners larger bonuses and dividends, and fooled investors to buy these same stocks as the most attractive relative asset – which is distortion.

A second unintended consequence is burdening the economy with unproductive assets and obsolete capital assets. Corporate borrowing to convert equity into debt raises systemic weakness across the economy. The Darwinian Selection process which drives growth and causes firms rise and fall according to their ability to manage themselves becomes distorted and lose momentum, leading to too many weak zombie indebted going-nowhere companies to block market niches more nimble new firms could more profitably fill. The long-term consequences are long-term rentier behaviour by owners, and declining real wages (and rising income inequality) as productivity across the nation slides as capital assets are not replaced and upgraded.

Long term, investment in replacing obsolete infrastructure, and the normalisation of interest rates to levels that create real returns to encourage real investments (into productive capital projects) rather than unproductive financial investments (such as already distorted stocks), would benefit the economy.

There is, however, a strong argument that 10-years of financial distortion through low interest rates, and the deliberate transfer of risk assets from the now heavily regulated banking sector into the more diverse investment management sector, now leaves the pension savings of millions of American’s vulnerable in the case of a stock market downturn.

This is an issue for the committee to determine…   
 
The fact The Fed is feeding the stock markets addiction to low rates will also play to Trumps re-election is irrelevant(ish).