Farewell, Liquidity

When crisis hits you, you learn a lesson, lesson everyone makes sure you never forget. They get written down in history and teach you forever. When it comes to financial crisis, from Tulip Bulb craze to The Great Depression to 1987 crash to 1997 Asian crisis to 2007-08 Financial crisis, all events taught us a moral & financial lesson and prepared us for the next crisis. With top risk management practices in place for corporates, they diligently manage the firm and social responsibilities. But what if the next crisis is not the result of irrationality of mob or fraud by corporates but by the Government itself consciously (or it seems so).

Such has happened recently when Fed hiked the rates and reduced its Balance Sheet in chorus knowing the beats would resonate and destabilize the global economy. Both actions of Federal Reserve in combination sucked up the global US Dollar liquidity.

With US – China trade war, the dollar became strong, their exports were less attractive but again did Fed’s policies had a direct impact on liquidity? China being the significant contributor to credit growth, growth in China’s economy leads to growth in global trade. With growing global trade and 90% settlement in USD, there is excess supply of USD in system, which eased financial condition globally causing weaker USD. Thus, Fed’s policies might not be the only driver of global liquidity. The global trade wars are a potential source and risk factor affecting global liquidity negatively.

Chinese bank’s foreign exchange sales have been steadily increasing showing a considerable amount of outflows from country. Despite this, strangely their currency reserves remain stable!

Emerging market equities were 20 – 30% lower from February to October, credit markets (bonds) didn’t fare much either. Along with this, the tariffs placed by US government on manufacturing turned things slow. After all, over $60T of global GDP is outside US.

The impact on market sentiment is much larger than meets the eye. When liquidity is being removed, investors sell assets and avoid buying risk assets during weeks when Fed is actively reducing size.     

 JP Morgan Strategy Research, 17th January, 2019.

Where does this leaves us then? Are the charts which were developed to prevent crisis indicating that one is anyway near us and this time the fault isn’t of institutions and of the mass but of ‘You – Know – Who’ and this wrecking ball is hitting everyone.

https://cp-in-13.webhostbox.net:2096/cpsess1472599625/3rdparty/squirrelmail/src/download.php?startMessage=16&passed_id=19506&mailbox=INBOX&ent_id=2&passed_ent_id=0

Charts That Matter-18th Feb

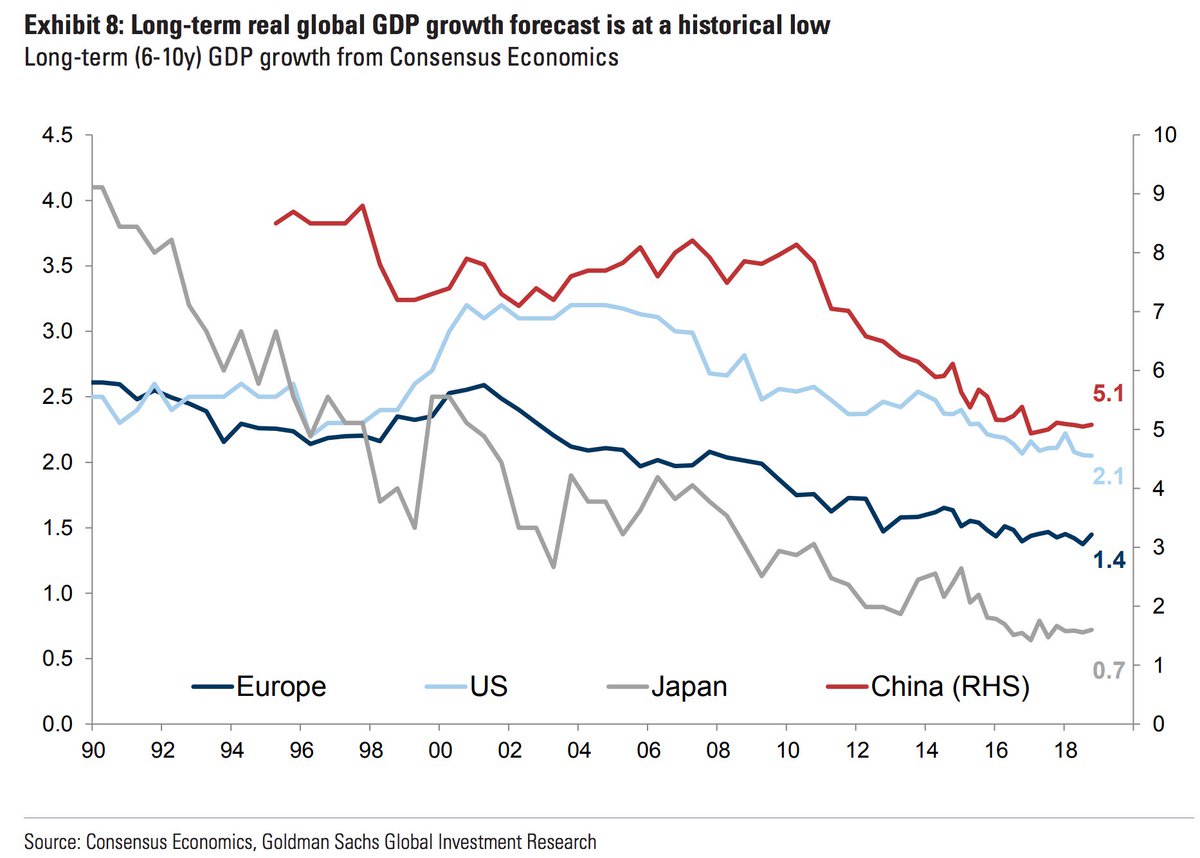
Long-term real global GDP growth forecast is at a historical low despite the move towards zero interest rates, the large expansion of central banks’ balance sheets and the substantial fiscal expansion in the US, Goldman shows. Trend growth has been slowing everywhere since GFC.

China’s biggest weakness is its dependence on semiconductor imports, primarily from US companies. China manufactures only 16% of the semiconductors it uses locally. Last year, the country spent $260 billion on chip imports, a value exceeding its oil imports. By interfering in the supply of semiconductors, America could choke China’s technological ambitions. Given that China will rely on US technology imports for the foreseeable future, Beijing may have little choice but to play by US rules in 2019. The corollary is political risks are diminishing rather than intensifying, as is widely perceived. Nearly half of economists surveyed by The Wall Street Journal said they viewed the US dispute with China as the biggest risk this year.(Stray Reflections)

The global fiscal impulse, which measures how much governments’ fiscal policy adds to or subtracts from overall economic growth, is set to turn even more positive this year. Fiscal deficits in four of the world’s biggest economies—the US, Europe, Japan and the UK—will rise to 3% of GDP in 2019, from 2.8% last year. The IMF expects the US fiscal impulse to reach almost 1% this year. Investors are making a huge mistake in their forward-looking evaluations by focusing exclusively on monetary policy. Central banks do not matter as much now that fiscal policy is taking over.

The foundations on which the shale boom was built is coming undone: cheap money, lower costs, rising productivity, and risk appetite. All-inclusive break-evens are about $51 in the Permian, $57 in the Eagle Ford and $64 in the Bakken. Oil prices at current levels will therefore start to drag on business investment in the coming year. Three aggressive independent Permian upstream operators have cut capital budgets by at least 12% to 15%. Shareholders are pushing companies to conservative capital spending plans and focus on free cash flow generation. The rig count is no longer increasing. There are signs oil productivity is also peaking as drillers have burned through their best assets. If the increase in shale oil production this year is more tepid than what many people are predicting, oil prices will move higher. Almost all other forms of oil supply have declined over the past few years. We see a drawdown in global oil inventories in 2019.(Stray Reflections)

Electronics exports from Singapore – the global hub of fabrication – plunge 15.9%, worst in 5 years. This is not just China – global trade has fallen off a cliff

United States vs China – A Tech War

Emerging industries such as AI/ML/quantum computing/advanced weapons systems/space/biotech & gene editing/clean energy/autonomous everything/IoT/cloud computing/cyber-physical systems etc. are imperative for both countries. The US has reached the point where a few tech giants are important economic drivers. Dominating new tech has become an absolute must to keep the US economy strong and military superior. If China were to beat the US national champions into the new era, it would tilt the strategic picture in a profound way. For China, they are stuck in the middle income trap and are stuck in an economic model driven by building “stuff.” They have run out of stuff to build at the scale needed to drive real growth. They have completely saturated their entire model. They are not getting enough return on debt spending on the easy button levers as I like to think of them – infrastructure/real estate/manufacturing. It is clear that China desperately needs higher value industries to take the baton so they can escape the middle income trap and grow into being a rich country before they get too old (not to mention pay down the enormous debts accumulated to build stuff). When you combine this with the inevitable reality that these new tech areas will drive high value production in the next generation – it is imperative for China to dominate new tech in order to meet their potential. Their strategic goals are all fantasies if they cannot transition their economy and drive a tech revolution that includes a powerful civil/military fusion in high end tech.

Read More

https://gallery.mailchimp.com/8cf38faa72e7f0cb6bb27e17e/files/18704a94-c53c-4d44-945c-161221d3a218/The_Emerald_Feb_2019.01.pdf

Weekly Commentary: No Holds Barred

Doug Noland writes……The world is now fully embroiled in a most precarious period. I wonder if the Fed is comfortable seeing the markets dash skyward – the small caps up 16.4% y-t-d, Banks 15.9%, Transports 15.2%, Biotechs 18.5% and the Semiconductors 17.0%. Or, perhaps, they’re quickly coming to recognize that they are now fully held hostage by market Bubbles.

Similarly, I ponder how Beijing feels about January’s booming Credit data – Aggregate Financing up $685 billion in a month. Do officials appreciate that they are completely held captive by history’s greatest Credit Bubble? I have argued that Bubbles have become a fundamental geopolitical device – a stratagem. Things have regressed to a veritable global Financial Arms Race. As China/U.S. trade negotiations seemingly head down the homestretch, each side must believe that rallying domestic markets beget negotiating power. Meanwhile, emboldened global markets behave as if they have attained power surpassing mighty militaries and even nuclear arsenals.

February 15 – Reuters (Kevin Yao and Judy Hua): “China’s banks made the most new loans on record in January – totaling 3.23 trillion yuan ($477bn) – as policymakers try to jumpstart sluggish investment and prevent a sharper slowdown in the world’s second-largest economy. Chinese banks tend to front-load loans early in the year to get higher-quality customers and win market share. But they have also faced months of pressure from regulators to step up lending, particularly to cash-starved smaller firms. Net new yuan lending last month was far more than expected and eclipsed the last high of 2.9 trillion yuan in January 2018. Analysts… had predicted new loans of 2.8 trillion yuan, more than double the level seen in December.”

January’s record China new bank loans were 11.4% higher than the previous record from January 2018 – and 15% above estimates. Bank Loans expanded an imprudent $821 billion over the past three months alone, a full 20% above the comparable period from one year ago. Total Bank Loans expanded 13.4% over the past year; 28% in two years; 45% in three years; 91% in five years; and an incredible 323% over the past decade.

Led by bubbling bank lending, China’s Aggregate Financing expanded a record $685 billion during January. Flood gates wide open. While typically a big month for Chinese lending, January’s growth in Aggregate Financing was 50% above January 2018. It’s worth noting that the growth in Aggregate Financing over the past six months ran 7% above the comparable year ago period (and equates to an annualized pace of $3.7 TN). Consumer (largely mortgage) Loans expanded a record $146 billion for the month, 10% greater than the previous record from January 2018. Consumer loans expanded 18% over the past year; 43% in two years; 77% in three; and 140% in five years.

It’s too fitting: as the long-standing global superpower and ascending superpower are locked in tortuous negotiations, their respective financial power centers – securities markets in the U.S. and state-directed bank lending in China – rage. No Holds Barred.

“The reason I’m giving the central bank an “F” is look at what’s happening in China and Asia… Look at what’s happening in Europe from the economic perspective. The U.S. stimulated at full employment with our tax cuts. That stimulus is about to wear off. What I worry about is the last three recessions we’ve had in the U.S. we’ve cut rates 500 bps. Now we can only cut them 225 or 250. And a week or two ago the San Francisco Fed put out a white paper about the benefits of negative interest rates. I hope that’s not where we’re going, but we can only cut rates about 225/250 bps to be at zero. So, this point of normalization should have happened long ago – not now. They were really late in the cycle in raising rates and now they’re stuck. So when we get into even a small recession, I don’t think we have the arrows in the quiver. And so let’s hope that we learned something from Japan and Europe about negative interest rates. They destroy the banking sectors and they have not helped their economies whatsoever…” Kyle Bass, Hayman Capital Management, appearing on Bloomberg Television, February 11, 2019

Seeing eye-to-eye with Kyle Bass, it has become difficult not to be thinking ahead to the next recession. And while Chinese Credit and ongoing aggressive global monetary stimulus can no doubt prolong the “Terminal Phase” of this most prolonged worldwide boom, this comes at a steep price.

Between July 2007 and December 2008, the Fed collapsed fed funds 500 bps. At least as important, 10-year Treasury yields sank about 300 bps during this period (520bps to 213bps). After ending June 2007 at 6.26%, benchmark Fannie Mae MBS yields closed out 2008 at 3.89%.

The Fed retained significant firepower to counter the bursting of the mortgage finance Bubble. Between August 2007 and March 2009, benchmark 30-year mortgage rates sank from about 6.70% to 4.85%. Importantly, by collapsing rates and purchasing large quantities of mortgage-backed securities, the Fed orchestrated a major mortgage refinancing boom. This, along with scores of government-assistance programs, allowed tens of millions of indebted homeowners to significantly reduce monthly mortgage payments. In particular, millions of higher-risk borrowers were able to replace old high-rate subprime mortgages for prime mortgages with dramatically lower payments.

At 4.37%, 30-year conventional mortgage rates are today already below the lowest levels from 2009. And with the vast majority of borrows over recent years having refinanced at historically low mortgage rates, there’s limited prospects for reduced monthly payments to dampen financial burdens during the next recession.

Worse yet, student loan debt has more than doubled since the crisis. And when the next recession hits, there will be record amounts of auto and Credit card debt.

February 12 – Reuters (Jonathan Spicer): “Some red flags emerged for the U.S. economy late last year as credit card inquiries fell, student-loan delinquencies remained high and riskier borrowers drove home automobiles, according to a report that could signal a downturn is on the horizon. The U.S. household debt and credit report… by the Federal Reserve Bank of New York, showed that the overall debt shouldered by Americans edged up to a record $13.5 trillion in the fourth quarter of 2018. It has risen consistently since 2013, when debt bottomed out after the last recession. While mortgage debt, by far the largest slice, slipped for the first time in two years, other forms of borrowing rose including that of credit cards, which at $870 billion matched its pre-crisis peak in 2008.”

Auto lending, in particular, has gone through a protracted – arguably unprecedented – period of loose lending.

February 12 – Washington Post (Heather Long): “A record 7 million Americans are 90 days or more behind on their auto loan payments, the Federal Reserve Bank of New York reported…, even more than during the wake of the financial crisis era. Economists warn this is a red flag. Despite the strong economy and low unemployment rate, many Americans are struggling to pay their bills. ‘The substantial and growing number of distressed borrowers suggests that not all Americans have benefited from the strong labor market,’ economists at the New York Fed wrote… A car loan is typically the first payment people make because a vehicle is critical to getting to work, and someone can live in a car if all else fails. When car loan delinquencies rise, it is a sign of significant duress among low-income and working-class Americans.”

February 13 – CNBC (Sarah O’Brien): “As Americans’ appetite for new cars continues unabated, an advocacy group is sounding the alarm over the growing level of auto debt carried by U.S. consumers. In a report…, U.S. PIRG warns that the continuing rise in auto debt is putting many consumers in a financially vulnerable position, which could worsen during an economic downturn… ‘More and more people are buying too much car for what they can afford,’ said Ed Mierzwinski, senior director of U.S. PIRG’s federal consumer program. The group’s new report delves into the financial implications and policy-related aspects of Americans’ reliance on cars. It shows that the aggregate amount of auto debt that consumers carry — roughly $1.27 trillion — is 75% more than the amount owed at the end of 2009… Overall, auto debt accounts for about 9% of total U.S. consumer debt, up from 6% in late 2011… Among subprime borrowers — those with credit scores below 620— the delinquency rate was 16.3% in mid-2018. In 2015, that figure was 12.4%… The average price of a new vehicle is now about $37,100, compared with $27,573 five years ago… As of January, the average amount financed was $31,707 and the average loan length had reached 69.1 months, up from 61 in 2010…”

And from the PIRG report: “The rise in automobile debt since the Great Recession leaves millions of Americans financially vulnerable — especially in the event of an economic downturn… Of all auto loans issued in the first two quarters of 2017, 42% carried a term of six years or longer, compared to just 26% in 2009… Many car buyers ‘roll over’ the unpaid portion of a car loan into a loan on a new vehicle, increasing their financial vulnerability… At the end of 2017, almost a third of all traded-in vehicles carried negative equity, with these vehicles being underwater by an average of $5,100… The increase in higher-cost ‘subprime’ loans has extended auto ownership to many households with low credit scores… In 2016, lending to borrowers with subprime and deep subprime credit scores made up as much as 26% of all auto loans originated.”

When it comes to Bubbles, the more conspicuous they are the less likely they are to be deeply systemic. The “tech” Bubble was obvious, yet the most egregious excess was contained within the technology sector. The mortgage finance Bubble was much more systemic, with excesses spread about and not as apparent. I believe today’s Super “Tech” Bubble is much more systemic than back in 2000. And while subprime is not the key issue it was for previous Bubble, I would argue that excess in many key housing markets is comparable. Commercial real estate on a national basis is likely more vulnerable today than in 2007, and the same could be said for some regional housing markets (i.e. greater “Silicon Valley”, Los Angeles, Seattle, Portland, Atlanta). Today’s Bubble in leveraged lending and M&A is greater than 2006/2007. The Bubble in corporate Credit dwarfs that from the mortgage finance Bubble period. Excesses throughout the securities markets phenomenally exceed those from the prior Bubble period. Moreover, I suspect the current level of derivatives-related speculative leverage could be multiples of 2007.

February 13 – Associated Press (Martin Crutsinger): “The government surpassed a dubious milestone this week: Its debt topped $22 trillion — that’s trillion, with a ‘t’ — for the first time. Piles of federal debt have been growing ever higher for years, fueled by accumulating annual deficits, which themselves have been driven by tax cuts, government spending increases and the mounting costs of Medicare and Social Security and interest on the debt itself.”

Thinking Ahead to the Next Recession, we should de deeply concerned about our nation’s tenuous fiscal position. To see deficits approaching 5% of GDP – with unemployment and interest rates at such historically low levels – should have us all fearful. Of course deficits matter. After ending 2007 at $8.056 TN, federal Liabilities (from Fed’s Z.1) surged $11.86 TN, or 147%, to end Q3 2018 at $19.918 TN. Over this period, outstanding Treasury Securities jumped $11.367 TN, or 188%, to $17.418 TN. And after ending 2007 at $7.40 TN, Agency Securities increased $1.62 TN, or 22%, to $9.02 TN. Over this period, combined Treasury and Agency securities almost doubled to $26.44 TN, expanding from 92% to 128% of GDP.

During the last crisis, the collapse in rates and market yields significantly mitigated the Treasury debt service burden. This ensured an outsized percentage of huge deficit spending went to bolster the real economy, with relatively less to debt holders. Come the next recession, already huge deficits will expand much larger, likely with only meager benefits from lower borrowing costs. Worse yet, there’s a scenario where fiscal recklessness finally leads to some market backlash. At some point, out of control deficits could be compounded by rising market yields – central bank stimulus notwithstanding.

And we definitely cannot ponder the next recession without taking a global view. Since the last crisis, global Credit Bubbles have become highly synchronized, securities markets atypically synchronized, and economies uncommonly synchronized. Synchronization also applies within the markets – equities, investment-grade and “junk” corporate Credit, sovereign debt, M&A – “developed” and “developing.” Global asset prices – certainly including real estate – notably synchronized. When it comes to a synchronized global policy response, keep in mind that ECB and BOJ policy rates are basically at zero – with little evidence of benefits from negative rates. The ECB just ended QE, while the BOJ just keeps printing. With little effective ammo, policymakers exploit what they can to sustain the Bubble and hold fragilities at bay.

To be sure, today’s backdrop overshadows the world’s predicament heading into 2008/09. China and EM, in particular, were in the midst of powerful expansions in 2008 – burgeoning Bubbles readily resuscitated post-U.S. crisis. Fueled by China’s massive stimulus, the emerging markets became the “growth locomotive” pulling the entire global economy away from a downward spiral. Pondering the future, it is not at all clear how a vigorous downward spiral is repelled come the next crisis.

Policymakers continue to throw enormous stimulus at global markets and economies. Instead of stabilization, we’ve witnessed ongoing Bubble inflation and intensifying Monetary Disorder. And the more Bubbles inflate, the greater the underlying financial and economic fragilities – and the quicker the Fed was to conclude “normalization” and China was to, once again, aggressively spur lending.

What worries me most is that underlying instability and vulnerabilities have policymakers resolved to abrogate bear markets and recessions. Extraordinary measures continue to be taken to nullify business and market cycles, with apparently no appreciation for how vital adjustments and corrections are to sound financial and economic systems. Worst of all, structurally maladjusted and highly speculative global markets are emboldened as never before. Party like it’s twenty nineteen – with global financial, economic and geopolitical backdrops uncomfortably reminiscent of ninety years ago.

http://creditbubblebulletin.blogspot.com/2019/02/weekly-commentary-no-holds-barred.html

Charts That Matter- 15th Feb

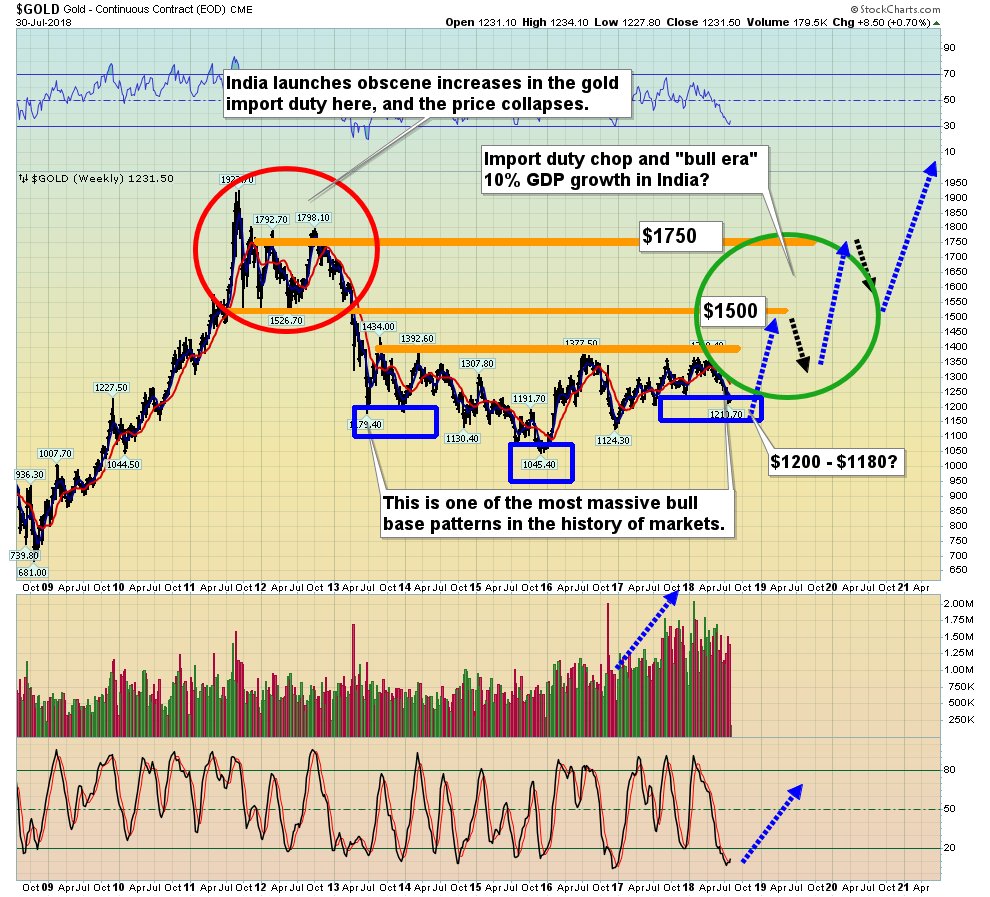
Edward Gofsky write “Big Picture, this is a great chart of the bullish scenario for gold . I am personally waiting until gold gets over $1400 and silver over $21 before I get aggressive. If this does play out in the future it could be a massive 10 year {C&H}

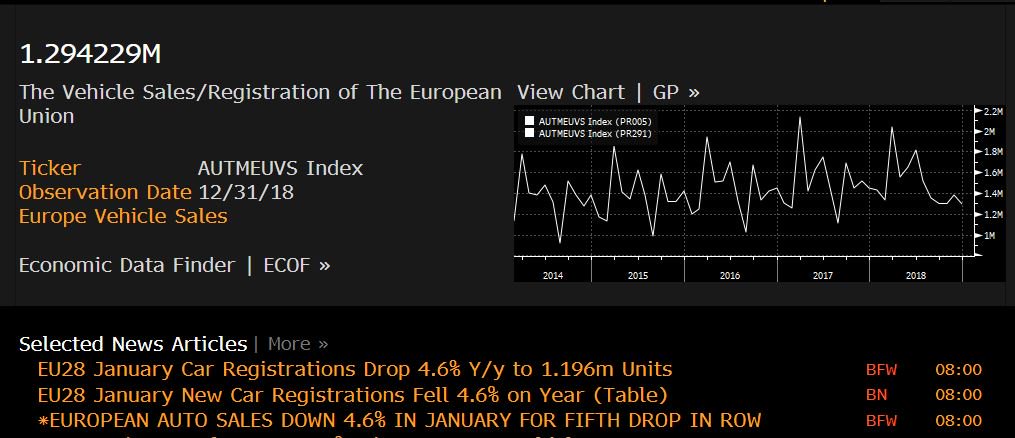
Eurozone slowdown. This is what the European Commission called “robust recovery”? European car sales plummet in January after five months of bad data.

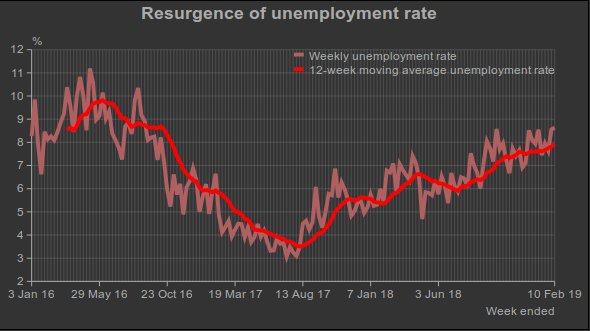
India Kissing Goodbye to Demographic Dividend- CMIE

India’s unemployment rate continues to rise. It has been rising steadily since July 2017 when it had reached its recent low of 3.4 per cent. The relentless rise in unemployment led to it peaking at 7.4 per cent in December 2018. Then it fell to 7.1 per cent in January. But faster-frequency estimations such as the weekly estimates and the 30-day moving average suggest a resurgence of the unemployment rate in February.https://bit.ly/2DuBWzd

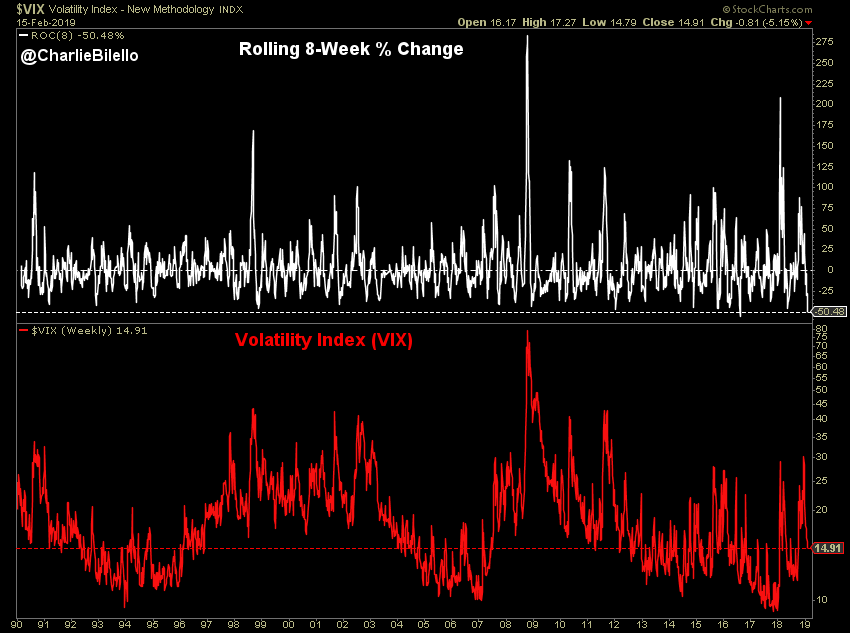
The Volatility Index has been cut in half over the past 8 weeks, the 2nd largest 8-week decline in its history.

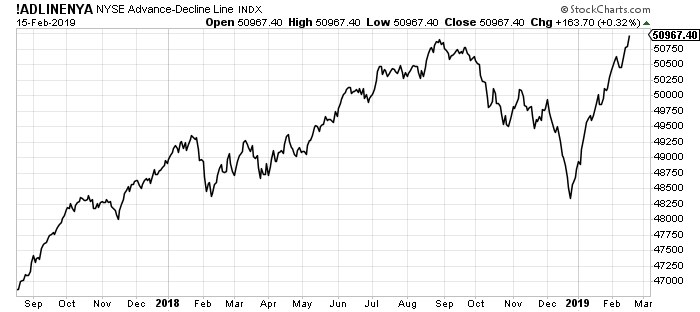
But the breadth is too strong. Probably the best breadth in Developed world market. What am I missing?

Redbook retail data from the early parts of 2019 indicate a horrible start to the year for retail sales as well (on top of the bad December reading).

80% of Chinese people’s wealth is in the form of real estate, totaling over $65 trillion in value — almost twice the size of all G-7 economies combined. A significant slowdown could, therefore, have a substantial impact on citizens’ financial health

Germany is the only Exception to the Global sovereign Debt Explosion

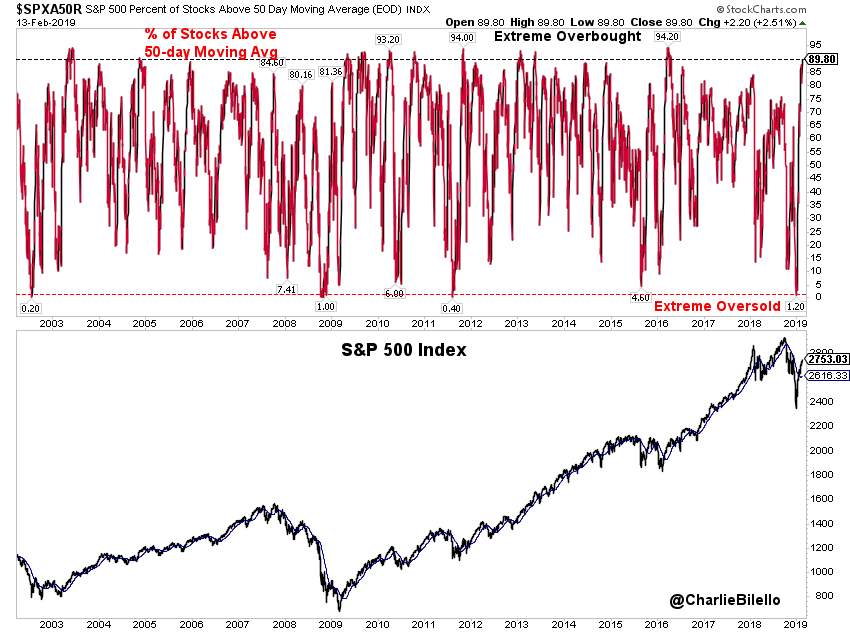
On Dec 24, only 1% of stocks in the S&P 500 closed above their 50-day moving avg, one of the most extreme oversold levels in history. After a 17% vertical rally, that number now stands at 89.8%, highest since April 2016 & in 97th percentile of historical readings. Mission Accompalished

A wrinkle in Euro

Going back in time when markets fell in 2007-08 Financial Crisis, US Dollar rebounded when the dust settled and Dollar continued to dominate world foreign exchange reserves followed by Euro. Surprisingly, Euro managed to capture only 20 percent of market share till today. Such difference in dominance is credited to higher liquidity of Dollar by Commission.After 2018 rate hikes in US, US Dollar surged 9 percent since April 2018 but it is now back to its 200 daily moving average yet the Euro/USD volatility is nearing to 15 year low. Unfortunately, Euro has become a puppet of risks and vagueness of Europe’s indecision.

While Pound is expected to remain volatile owing to ambiguity surrounding Brexit in March 2019 and is bearing an intense selling pressure accompanied by weak economic data, Euro is shrouded by negatively moving clouds which are not settling anytime soon. The risks causing Euro’s fickle movements are found in nearing Brexit day, German auto tariffs, US – China trade war and Russian sanctions so it’s not hard to imagine volatility in European markets.

The bearish outlook of Euro is also revealed in Elliot wave patterns and it is quite revealing. The chart is very bearish Euro and bullish Dollar as can be seen below.

Above shown are plots of Euro ETF and British Pound ETF indicating clearly the weakness of Euro in comparison to Pound which recently surged after indecision on Brexit came into view.

This month, the Bank of England issued its strongest warning to EU that “its lack of adequate planning for Brexit has created growing risks for almost 70tn pounds of complex financial contracts. EU firms have about 69tn pounds of outstanding derivatives contracts that are handled through a process known as ‘clearing’ in UK while as much as 41tn pounds maturing after Britain exit EU in March 2019.”

Conclusion

A weak currency is a boon for exporters and also leads to higher imported inflation but eurozone GDP is not only stagnating its exports are also struggling, not to mention falling inflation and inflation expectations . I would have expected eurozone equities to get a tailwind but most European indices are  showing weakness compared to US equity indices. I am firmly of the opinion that capital is leaving Europe for US shores and this is not good news for Euro or Eurozone assets. If our view is right, then we expect to see parity on Euro/Dollar before this year is over.

Sources:

  1. https://www.tradingonthemark.com/2019/02/12/is-the-euro-getting-ready-to-fold-special-newsletter-edition/
  2. Brexit – Band Aid Report by Bear Traps Report
  3. https://www.reuters.com/article/us-eu-oil-usa/eu-brings-industry-together-to-tackle-dollar-dominance-in-energy-trade-idUSKCN1Q21WB
  4. https://www.theguardian.com/business/2018/oct/09/bank-of-england-warns-eu-brexit-risk-financial-stability-derivatives

KNOW WHEN TO FOLD ‘EM!

With sizeable increase in individuals who put their faith in central bank and corporates by investing in bond mutual funds to earn regular income or capital appreciation ,have been given a warning recently by Fitch explicitly mentioning that these bond funds are ‘a potential source of financial instability’.

The causes for the instability and probable crash in credit markets are designated by terms “global QE, prolonged low yields, technology and a wave of regulation”. The daunting new reality of dramatic fall in bond markets LIQUIDITY is yet to be learned by markets and investors.

All these fancy terms hide the fact that there have been shocks in the market since Federal Reserve released a statement in 2014 about its expected approach to its Balance Sheet Shrinkage after which followed the global QE or commonly said as ‘normalization of interest rates’.

Goldman Sachs economists wrote at the start of QT that “FOMC will begin to reduce the Balance Sheet at the end of 2017. They assume that the Fed will allow two thirds of maturing debt to run off in 2018 and rest all of it in 2019. If this happens in hawkish manner it may indicate that the total Balance Sheet assets of global central banks will start to fall as a percentage of world GDP for first time since the Financial Crisis of 2009. It would be crucial at this time that the markets and investors learn to get along without massive bond purchases from central banks.“. Goldman it seems turned out to be right on mark as markets are yet to come to terms with shrinking bond market liquidity

With falling interest rates and lower yields to investors from the bond funds, the run on the fund is evitable which will complicate market health thereby leading to instability.As more and more fund managers increase their share of holding in technological companies (FAANG +M) as investors desire returns at least equivalent to market return, the more is the market overvaluing those corporates leading to bigger increase in stock prices but time is not far when the wave to invest in corporate bonds and irrationality among investors having blind faith in system and managers who are passively managing funds yet again will come crashing down. 

Fitch pointed out, “Bonds of higher quality liquid issuers in recent times have traded down a percentage point or two, whereas lower quality, less- liquid names dropped three to five points…”

They further explains, “…while previous periods of micro – level stresses in bond fund universe did not threaten financial stability, the rapid growth in open end credit – funds and the significant distortions to credit market caused by QE mean that market conditions look very different now.” And indeed they do.   With the crash of Third Avenue’s bond fund in late 2015, markets did react but it did not lead to tumbling down which is now the fear among most.

Conclusion

Knowing when to exit is the most fundamental aspect that people miss and they find themselves in bed with the rocks when they could have plucked flowers and walked away. Climate is changing and you’d be better off by acknowledging that this might be necessary on a macro scale and by taking responsibility by not being a part of contagion that has begun but by taking calculated risks and investing intelligently.

Bibliography:

  1. https://wolfstreet.com/2019/02/11/bond-funds-are-potential-source-of-financial-instability-after-years-of-global-qe-and-low-interest-rates-fitch/
  2. https://www.yardeni.com/pub/peacockfedecbassets.pdf
  3. https://www.federalreserve.gov/newsevents/pressreleases/monetary20140917c.htm

https://www.ft.com/content/603e6955-31f6-312a-a143-f70614879ec0 000000000000

Charts That Matter- 13th Feb

This is now the widest drop in Consumer Confidence Present Situation vs. Expectations since the Tech Bust. Every other cyclical decline in the past 50 years led to a recession @hussmanjp

The BALTIC DRY INDEX continues to decline today It’s already very difficult to explain this only in seasonality … Is the world trade simply frozen ?

We are seeing record divergence. Either the Fed gets hawkish again, or the economy rolls over hard. This spread is historic and CANNOT hold. Something has to break one way or the other. Neither is good for stocks.

Something is at a Nine year high except that it is not pretty.

Some 485,000 U.S. workers were involved in 20 major strikes and lockouts last year, the largest number since 1986. what am I missing in the best economy ever?

Australia’s new credit growth is still in free fall and suggest much further downside for house prices ahead..

China is acquiring more in Europe, less in China

Yellow Light

361 capital write….”Back to macro market worries as: 1) U.S./China trade talks ramp up, 2) The U.S. Government heads for another Shutdown on Friday and 3) Global growth data points continue to lean toward a slow down. Confirming the markets worries, global bond yields are in retreat with many countries looking at three-year low yields. With the U.S. performing better on a relative basis, the recent U.S. dollar strength does its best to make those who called the opposite look foolish after the Fed’s change in direction away from tightening. Little on the micro front will be able to offset any news from the big three macro items above. So keep an ear adjusted to your squawk box, or eyes on the front page headlines because this news will move the markets for the time being.

Read full article below

https://361capital.com/weekly-briefing/yellow-light/?utm_source=wrb&utm_medium=email&utm_campaign=02112019&utm_content=p