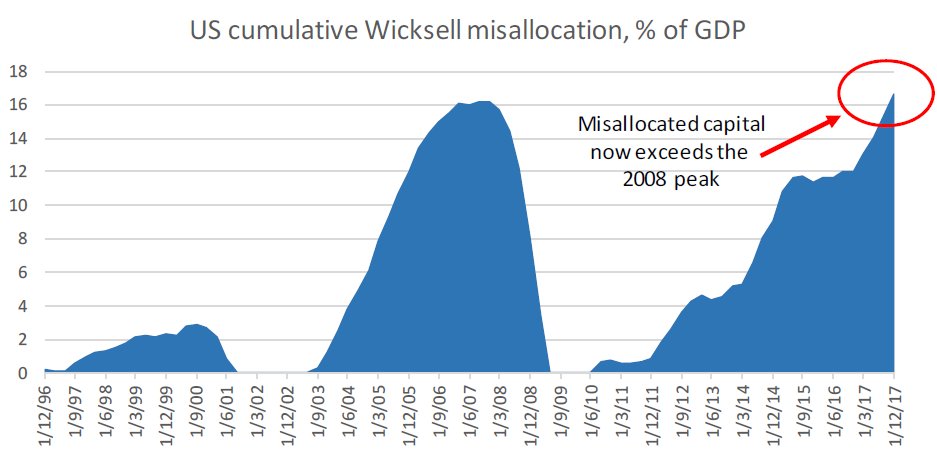
Wicksell Spread: There is a greater degree of capital misallocation today than there was on the eve of the great financial crisis and five times more than in 2000.

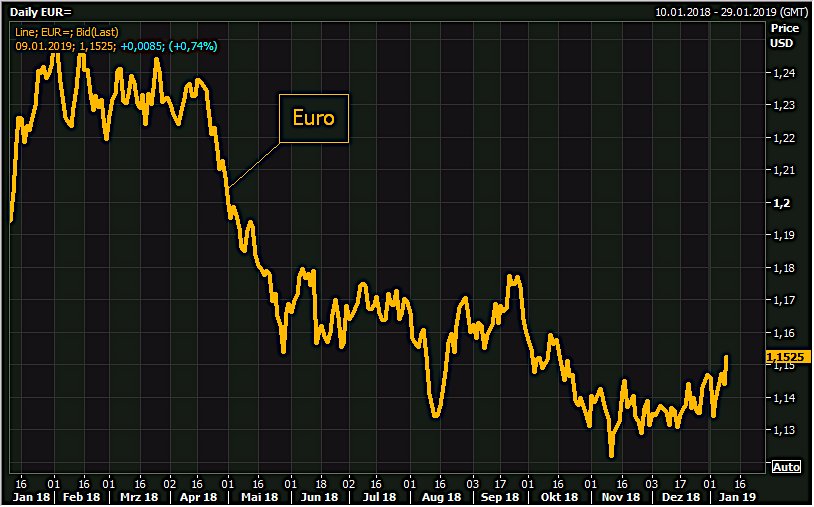
Euro Jumps >$1.15 on Dollar weakness following dovish Fed remarks. Fed member Bostic says policy could move in either direction: open to rate cut if downside risks all come to bear.

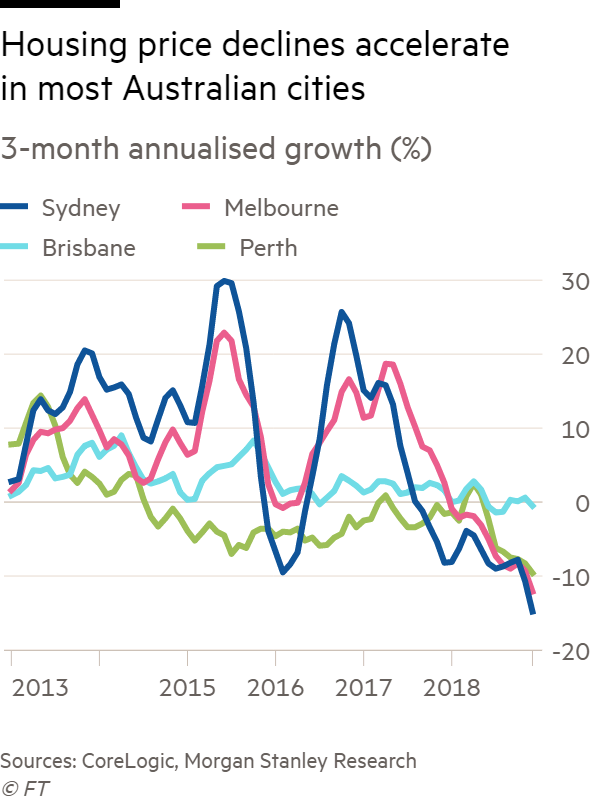
Australia’s house price slide is now the deepest in 35 years: posing a serious threat to the lucky country’s record breaking economic run

The offshore Chinese yuan climbed to the strongest level since August …..impressive and this is the invisible hand in risk rally

Great excerpt from new @Realvision interview with Diego Parrilla

Charts That Matter- 8th Jan

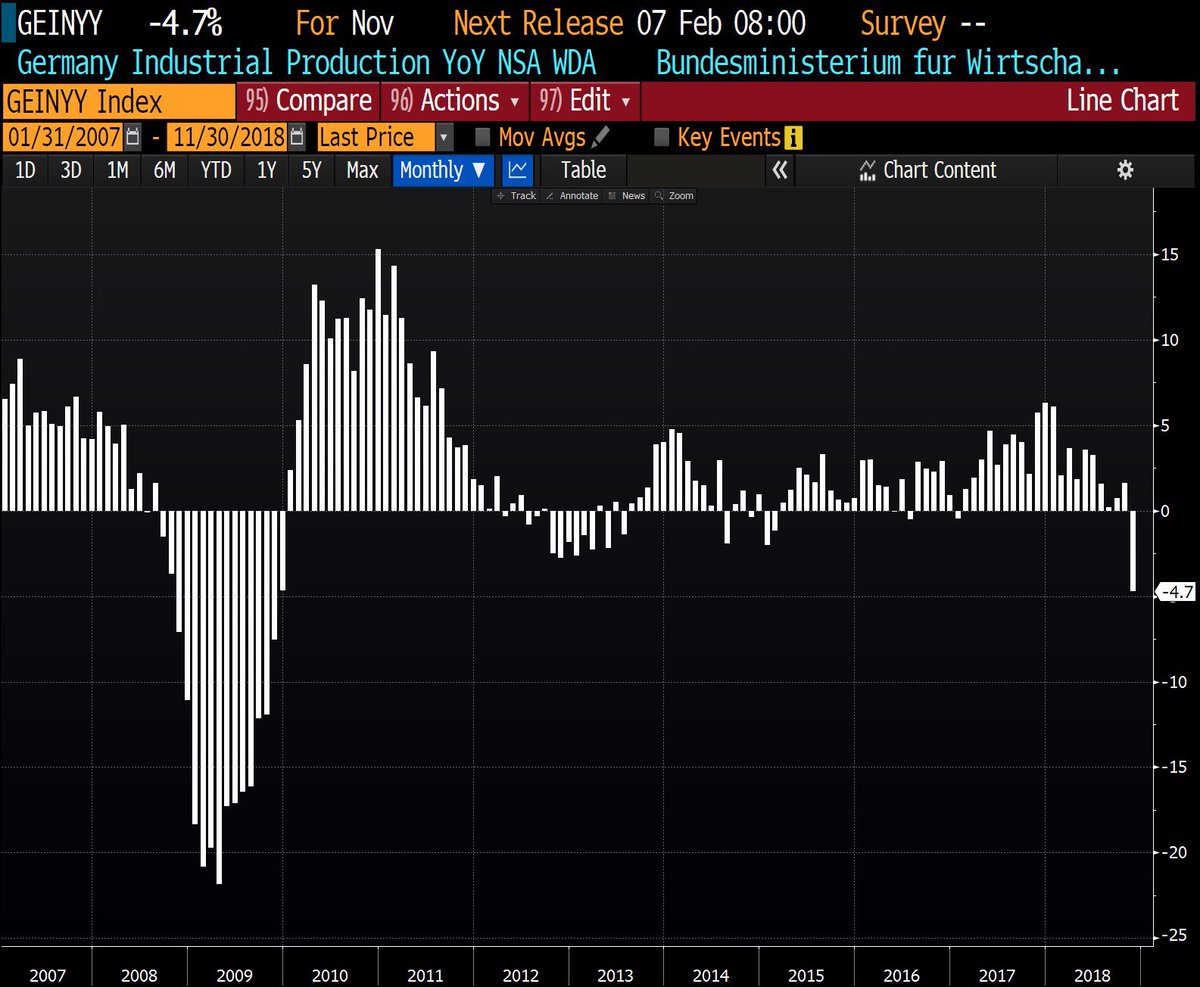
Germany industrial production fell by a whopping 4.7% YoY in December, the biggest decline since December 2009!

More

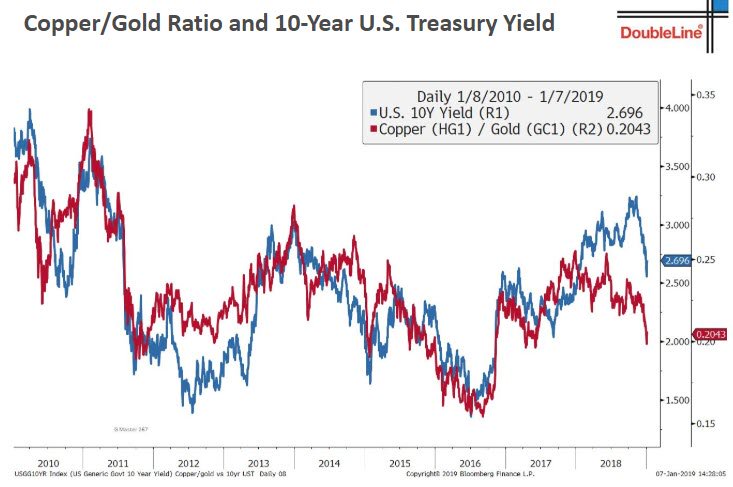
Jeff Gundlach: The Treasury vs copper/gold ratio suggests that 10Y yields are going much lower…… I agree

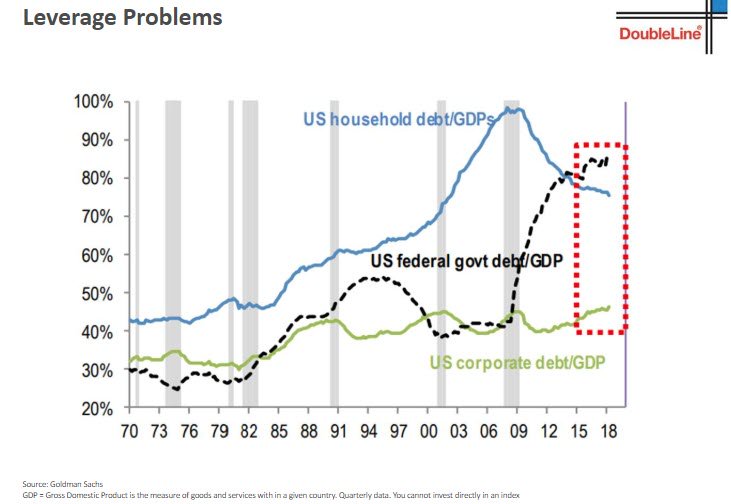
Household are leveraged. Govt spending is what is supporting the economy and Corporate sector does not want to take any more debt ( except for buybacks)

This is a completely horrific situation” – Gundlach

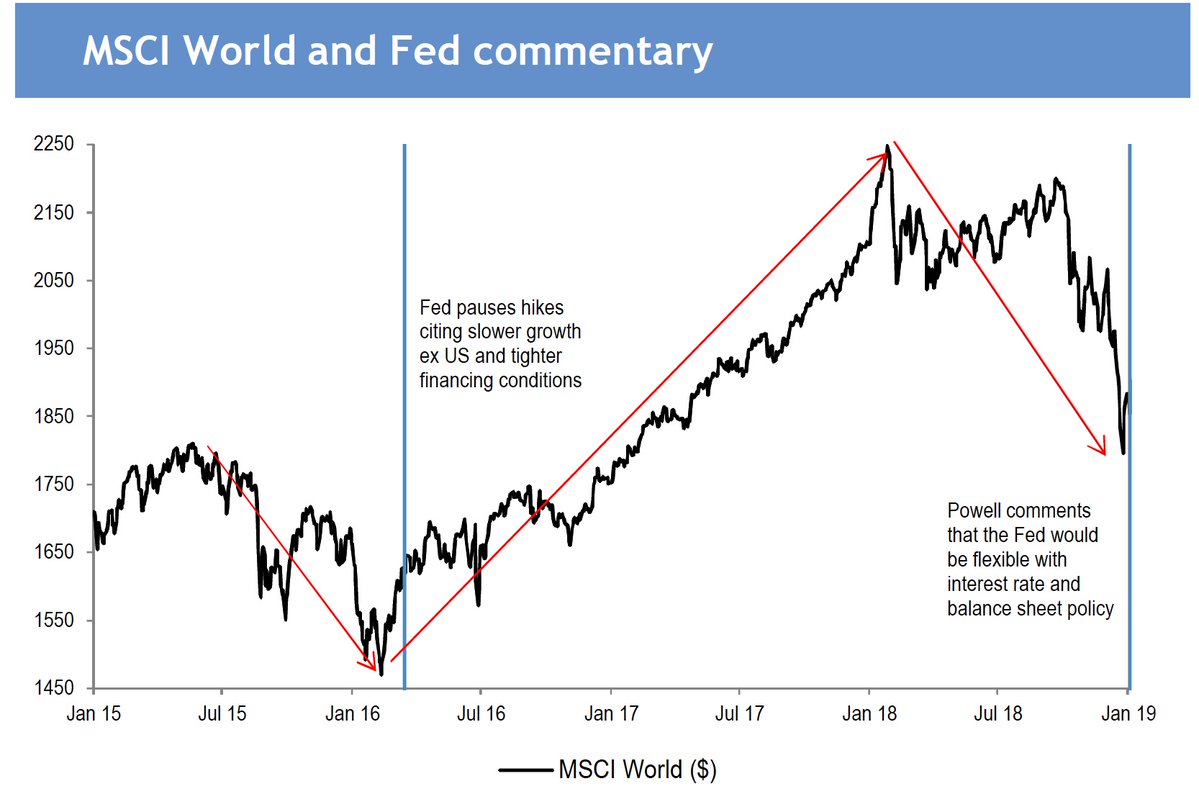
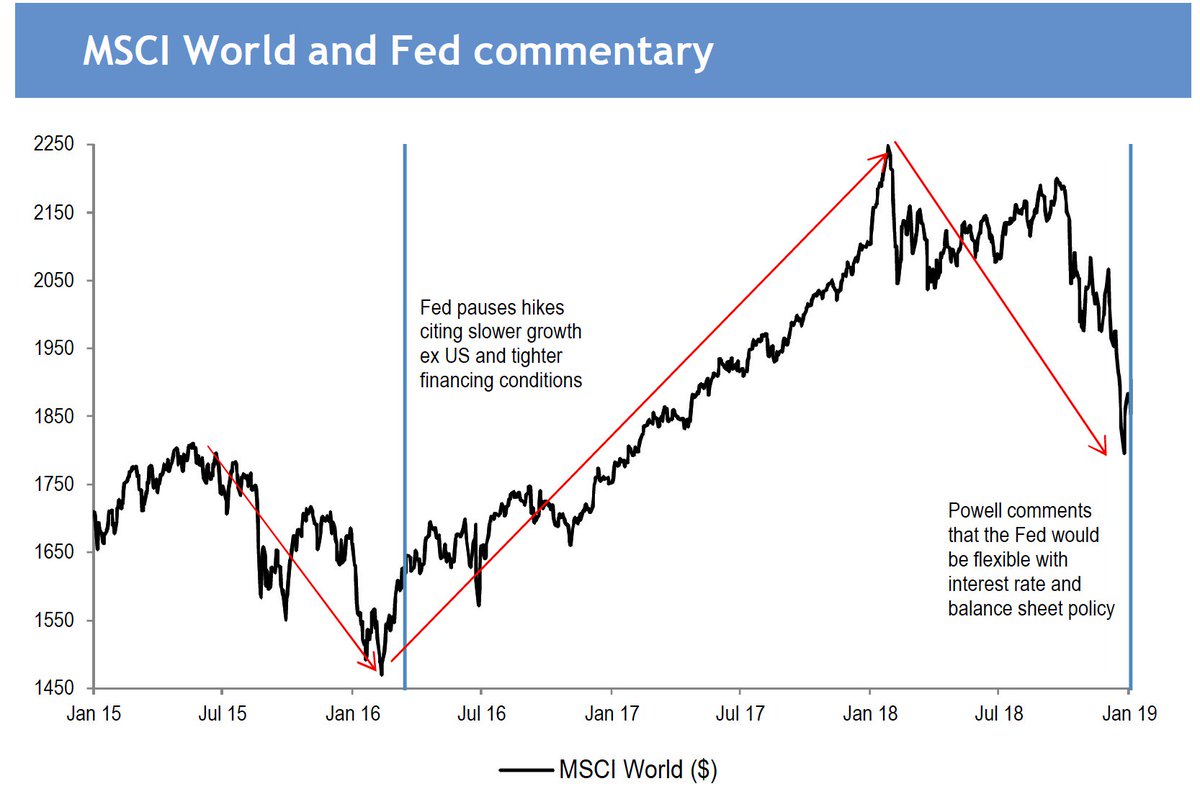
JP Morgan says recent sell-off in global markets has a striking similarity to the one in late 2015, which may offer a glimmer of hope for 2019. In 2016 recession didn’t materialise. What stopped the rot were Fed, USD & China stimulus; all these could be inflecting again.

Goldman cut a swathe of global 10-Year yield calls, says we have seen the cycle top for U.S. 10-Year Treasury yields

Under Pressure

Indiacharts writes….We are a world under pressure. It is brewing below, the Nifty cannot see it, and bank nifty thinks banks will make money even if there is a slowdown in consumption. But global growth has given in and the pressure is not going away any time soon.

Few are watching the French revolution and it is a surprise as Italy should have been the one on the streets. But social mood develops in crowds and it takes one leader to identify that trend. The roots may lie in the poor French economic data

DwThR72VAAEtl7d

A few days ago then CMIE released a follow up to its June data that again shows slowing projects growth just when the street is talking about a Capex revival. I am not sure if the two are linked as the Capex talk also comes on the back of capacity utilisation levels. But for now we have this

ScreenShot-2019-Jan-03-605-PM

and simultaneously we have no new project announcements. With elections around the corner I do not think we will see a change in these trends very fast as the government plays a role on this front.

ScreenShot-2019-Jan-03-603-PM

On the other hand this chart from Hedgeye.com goes on to explain why the recent wage growth data is ominous. I showed the wage inflation chart in the Long Short report and the first thought that comes to mind is Stagflation. But there is a more important point to that. the wage inflation itself can become cause for an earnings contraction if you look at the impact on margins here during late-cycle. 

Screenshot 20181215-114028

All of that then feeds into earnings expectations eventually. This time around it started from countries other than the US but is now getting built into expectations, source twitter posts.

Dv-bAx1X4AEA Df

We are rejoicing in the headlines that tell us that our growth is bigger than the rest in % terms. Furthermore the troubles in Europe recently led to the Market Cap of Germany falling below the Market Cap of India. Unusual for a country that hardly would stand a chance to compete against German exports because of both pricing and technology. Germany commands a premium for a lot of its equipment for that reason. It is not on a price war based on labor arbitrage, like India.

But the business cycle today has created an unusual difference that does not even mean that our per capital incomes are comparable. But in a world where capital must find the cleanest shirt to hide in, the result is a record valuation premium.

IMG 20180917 141116

But how long does it take a white shirt to get stained especially if you are playing in the same arena. The dirt will fly and you cannot escape it forever. As we are about to find out. Several Research houses are cutting back forecasts for the Dec-2018 quarter on earnings but still maintaining 25%+ growth for FY2020. This after doing so repeatedly for 3 years in a row. Now it is banking a lot on base effects and sure that is just math, but is it reason enough? [chart as reported in ET]

IMG 20190104 084952  01

One data point that just came in last week is the Debt to GDP ratio after adjusting for latest NBFC data in the RBI report released a week ago. I peg it at 161% of GDP govt+Bank+NBFC debt combined for FY2018. The surprise number however is going to be for NBFCs in FY2019, as the first half into SEP shows almost 100% growth in new loans and advances. In % terms NBFC credit to GDP is now a sizeable 20% this year. Yes that is where the economic growth for this year came from then. After all in a credit based economy credit=growth.

Could Oil End the Global Super Cycle?

We know a few things about oil in the coming years:

1) Investment is down significantly

2) We are finding less oil than we have in 75 years

3) Shale loses money

4) Shale depends on investors willing to fund the losses

5) Shale depends on low interest rates

6) About half of US production is shale & the US is the world’s largest producer

7) We need more oil just to meet growing demand and old wells dying

http://www.pineconemacro.com/uploads/2/8/3/3/28331049/pinecone_macro_special_report_-_oil_and_the_super_cycle.pdf

Weekly Commentary: Global Markets’ Plumbing Problem


Doug Noland writes… “Goldilocks with a capital ‘J’,” exclaimed an enthusiastic Bloomberg Television analyst. The Dow was up 747 points in Friday trading (more than erasing Thursday’s 660-point drubbing) on the back of a stellar jobs report and market-soothing comments from Fed Chairman “Jay” Powell.

December non-farm payrolls surged 312,000. The strongest job gains since February blew away both estimates (184k) and November job creation (revised up 21k to 176k). Manufacturing jobs jumped 32,000 (3-month gain 88k), the biggest increase since December 2017’s 39,000. Average Hourly Earnings rose a stronger-than-expected 0.4% for the month (high since August), pushing y-o-y gains to 3.2%, near the high going back to April 2009.

Just 90 minutes following the jobs report, Chairman Powell joined Janet Yellen and Ben Bernanke for a panel discussion at an American Economic Association meeting in Atlanta. Powell’s comments were not expected to be policy focused (his post-FOMC press conference only two weeks ago). But the Fed Chairman immediately pulled out some prepared comments, perhaps crafted over the previous 24 hours (of rapidly deteriorating global market conditions).

Chairman Powell: “Financial markets have been sending different signals – signals of concern about downside risks, about slowing global growth particularly related to China, about ongoing trade negotiations, about – let’s call – general policy uncertainty coming out of Washington, among other factors. You do have this difference between, on the one hand, strong data, and some tension between financial markets that are signaling concern and downside risks. And the question is, within those contrasting set of factors, how should we think about the outlook and how should we think about monetary policy going forward. When we get conflicting signals, as is not infrequently the case, policy is very much about risk management. And I’ll offer a couple thoughts on that… First, as always, there is no preset path for policy. And particularly, with the muted inflation readings that we’ve seen coming in, we will be patient as we watch to see how the economy evolves. But we’re always prepared to shift the stance of policy and to shift it significantly if necessary, in order to promote our statutory goals of maximum employment and stable prices. And I’d like to point to a recent example when the committee did just that in early 2016… As many of you will recall, in December 2015 when we lifted off from the zero bound, the median FOMC participant expected four rate increases for 2016. But very early in the year, in 2016, financial conditions tightened quite sharply and under Janet’s leadership, the committee nimbly – and I would say flexibly – adjusted our expected rate path. We did eventually raise rates a full year later in December 2016. Meanwhile, the economy weathered a soft patch in the first half of 2016 and then got back on track. And gradual policy normalization resumed. No one knows whether this year will be like 2016, but what I do know is that we will be prepared to adjust policy quickly and flexibly and to use all of our tools to support the economy should that be appropriate to keep the expansion on track, to keep the labor market strong and to keep inflation near 2%.”

Powell heedfully hit key market hot buttons: “…Policy is very much about risk management.” “We will be patient as we watch to see how the economy evolves…” “…Always prepared to shift the stance of policy and to shift it significantly if necessary…” “We will be prepared to adjust policy quickly and flexibly and to use all of our tools to support the economy…” A Bloomberg headline: “Powell Shows He Cares About Markets.” Markets heard assurances of an operative “Fed put” – with rate cuts and QE (“all of our tools”) available when demanded – and it was off to the races. The Nasdaq Composite surged 4.3%, the small cap Russell 2000 3.8% and the S&P500 3.4%. The Goldman Sachs Most Short index rose 3.8% in Friday trading.

Treasury investors, of late fixated on mounting global fragilities, saw the data, listened intently to Powell, glared at surging stock prices – and recoiled. Ten-year yields jumped 11 bps in Friday trading, with five-yields surging 14 bps. Friday’s equities buyers’ panic masked troubling market behavior over the previous week – important developments not to be swept under the rug.

January 4 – Financial Times (Robin Wigglesworth): “Housebuyers always carefully study the kitchen fittings and measure up the airy living room, but often neglect to check whether the pipes are up to scratch. Investors act similarly, often forgetting that dodgy market plumbing can lead to a smelly catastrophe. There has been no shortage of culprits offered up to explain the worst month for US markets since the financial crisis, with conveniently nebulous ‘algorithms’ emerging as a particularly popular bogeyman. But on New Year’s Eve a little-watched corner of the US money markets offered up clues as to another, arguably stronger candidate as a contributor to the recent volatility. On Dec 31, the rate on ‘general collateral’ overnight repurchase agreements suddenly rocketed from 2.56% to 6.125%, its highest level since 2001. This was a huge move, the single biggest outright percentage jump since at least 1998. The repo rate has since normalised, but the severity of the spike indicates that at least part of the market’s plumbing gummed up.”

The Global Markets’ Plumbing Problem didn’t unclog with the passing of year-end funding pressures.

January 3 – Bloomberg (Ruth Carson and Michael G Wilson): “It took seven minutes for the yen to surge through levels that have held through almost a decade. In those wild minutes from about 9:30 a.m. Sydney, the yen jumped almost 8% against the Australian dollar to its strongest since 2009, and surged 10% versus the Turkish lira. The Japanese currency rose at least 1% versus all its Group-of-10 peers, bursting through the 72 per Aussie level that has held through a trade war, a stock rout, Italy’s budget dispute and Federal Reserve rate hikes. Traders across Asia and Europe are still seeking to piece together what happened in those minutes when orders flooded in to sell Australia’s dollar and Turkey’s lira against the yen… Whatever the cause, the moves were exacerbated by algorithmic programs and thin liquidity with Japan on holiday.”

Thursday’s market gyrations hinted at a quite disconcerting scenario: illiquidity, dislocation and a “seizing up” of global markets. The day saw an 8% move in the yen vs. Australian dollar – two major – and supposedly highly liquid – global currencies. Trading in the yen dislocated across the currencies market, a so-called “flash crash.” We’ve seen the occasional “flash crash” in equities over the past decade. These abrupt bouts of selling and illiquidity reversed in relatively short order, with recovery only emboldening animal spirits. These recoveries, in contrast the current backdrop, were supported by expanding global central bank balance sheets (QE/liquidity).

I’m concerned that Thursday’s currency “flash crash” has potentially dire implications. Together with other key market indicators, evidence of systemic illiquidity risk is mounting. De-risking/deleveraging dynamics continue to gain momentum globally. Moreover, there are literally hundreds of Trillions of currency-related derivatives transactions – a byzantine edifice fabricated on a flimsy assumption of “liquid and continuous markets.”

I suspect the “global” derivatives marketplace is today much more global than the U.S.-dominated market heading into the 2008 crisis. This implies scores of new players, certainly including Chinese and Asian institutions. This suggests different types of strategies, complexities, counterparties and risks more generally. It certainly raises the issue of regulatory oversight along with potential policy challenges in the event of a globalized market dislocation. Interestingly, the AIG bailout was mentioned in Friday’s Fed head panel discussion. It’s been about a decade of derivative risk complacency.

When it comes to current global systemic liquidity risks, the Japanese yen may be the single-most critical global currency. Trillions have flowed out of Japan to play higher global yields. Zero Japanese rates and, importantly, negative market yields forced so-called “Mrs. Watanabe” to forage global securities markets in search of positive returns.

Years of radical monetary policies coerced enormous quantities of Japanese household savings into the realm of international securities and currency speculation. Likely an even greater source of global liquidity materialized from “carry trade” speculations – borrowing at zero (or negative yields) in Japan to finance levered holdings in higher-yielding instruments around the world – certainly including in Australia.

Keep in mind also that massive (reckless) BOJ balance sheet growth seemed to ensure a weak Japanese currency. Prospective yen devaluation has been integral to the yen becoming a prevailing “funding” currency for global speculation throughout this historic global government finance Bubble period (what’s better than borrowing for free in a currency you expect to be worth less in the future?). “King dollar,” with its positive rate differentials, shrinking Fed balance sheet and booming markets, bolstered the case for the yen as dominant global funding currency.

Thursday’s yen dislocation was quickly transmitted across global bond markets. After beginning the new year at an incredibly meager 0.005%, Japanese 10-year “JGB” yields in Friday trading dropped to a low of negative 0.054%, before closing at negative 0.045% – a 13-month low. Ten-year Treasury yields began Wednesday trading at 2.69%. Yields then sank to as low as 2.54% in late-Thursday trading, an almost one-year low. At that point, Treasury yields had collapsed 70 bps since the 3.24% closing yield on November 8th. And after beginning 2019 at 23 bps, German 10-year bund yields sank to as low as 15 bps in Thursday trading (down 30bps since Nov. 8th).

Italian yields, after trading Wednesday at a five-month low 2.66%, abruptly reversed course Thursday to close the session 20 bps higher at 2.86% (ending the week up 16bps to 2.90%). With their relatively high yields, Italian bonds have likely been a target of Japanese savers and yen “carry trade” speculators. Curiously, Portuguese 10-year yields, trading down to 1.69% Wednesday, reversed course and traded as high at 1.82% Friday before ending the week up nine bps to 1.81%. This week saw spreads to German bunds widen 19 bps in Italy, 12 bps in Portugal, nine bps in Spain and seven bps in Greece. European high-yield (iTraxx Crossover) CDS was up 12 bps for the week at Thursday’s close, the high going back to June 2016. European bank index CDS prices also rose to two-year highs in Thursday trading.

It’s worth noting that Goldman Sachs Credit default swap (5yr CDS) prices surged an eye-opening 19 bps in Thursday trading to 129 bps, the high going back to the early-2016 market tumult period. Goldman CDS traded below 60 in early-October, before ending October at 77 bps, November at 87 bps and closing out 2018 at 106 bps. Deutsche Bank CDS rose seven bps Thursday to 218 bps, near the highest level since 2016. Many large financial institutions saw CDS prices rise this week to highs going back to 2016 (Goldman up 17bps, Morgan Stanley 14 bps, Nomura 11 bps, Citigroup 9 bps and BofA 8 bps).

U.S. junk bonds were under significant pressure. U.S. high-yield corporate bond yields (Bloomberg Barclays average OAS index) jumped 10 bps Thursday to 5.37%, the high going back to July 2016. Energy-related debt was not helped by WTI crude trading as low as $44.35 in Wednesday trading, before reversing course and ending the week up almost 6% to $47.96. Investment-grade corporate spreads to Treasuries traded Thursday to new two-year highs (and narrowed little Friday).

Gold is worthy of a mention. Spot bullion traded to $1,299 Friday morning (pre-payrolls/Powell), the high since June. Bullion gained $10 in Thursday trading and was up $18 for the week at Friday highs (before closing the week up $4 to $1,285). As global systemic risk builds, Gold is demonstrating safe haven attributes.

And speaking of global systemic risk: China.

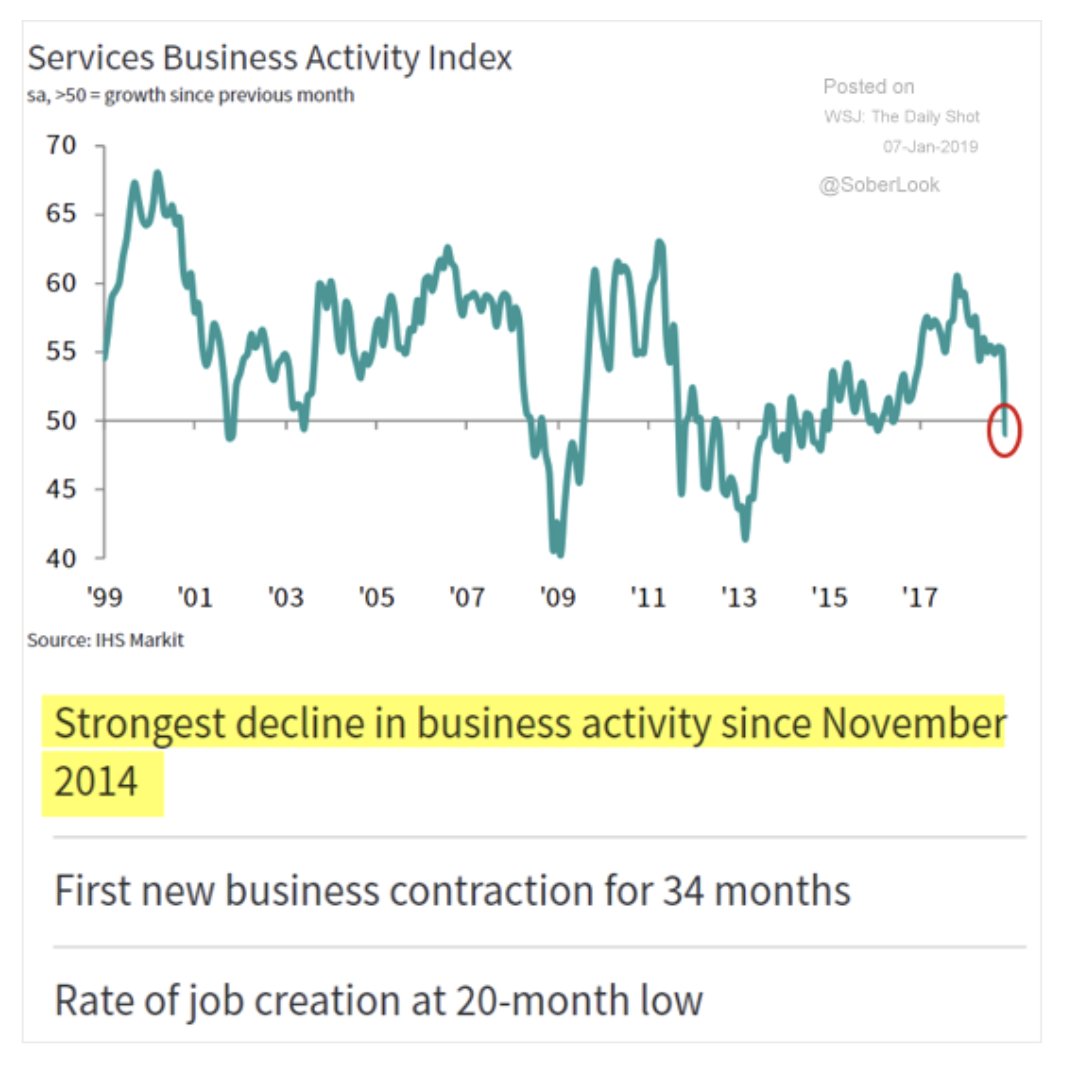
January 2 – Wall Street Journal (Nathaniel Taplin): “Champagne or no, New Year’s Eve must have been a somber affair for China’s top leadership, with word that manufacturing activity declined in December for the first time since 2016. The bad news from the official purchasing managers index was confirmed Wednesday by the privately compiled Caixin index, which further showed new orders in December down for the first time in 2½ years. It’s a sign that nine months of monetary easing by the central bank has failed to boost lending to the real economy, though it has succeeded in pushing housing and government-bond prices into bubbly territory. This kink in China’s monetary-policy machinery bodes ill for 2019, and makes predictions that growth could bottom out in the first quarter look optimistic. Where banks are lending again, it’s mostly to other financial institutions and the government, not the cash-starved private companies that really drive growth.”

Hong Kong’s Hang Seng index dropped 2.8% during the first trading session of 2019 (down 3.6% y-t-d at Thursday’s lows). The Shanghai Composite was down more than 2% y-t-d as of early Friday, trading at the lowest level since November 2014. An abrupt 3% rally pushed the index positive (up 0.8%) for the first few sessions 2019. The People’s Bank of China Friday announced another reduction in reserve requirements (0.5%).

From Reuters (Kevin Yao and Lusha Zhang): “The announcement came just hours after Premier Li Keqiang said China would take further action to bolster the economy, including reserve requirement ratio (RRR) cuts and more cuts in taxes and fees, highlighting the urgency to cope with increasing headwinds. ‘This speedy RRR cut with great intensity fully demonstrates the determination of policymakers to stabilize growth,’ said Yang Hao, an analyst at Nanjing Securities.”

It’s hardly coincidence that Powell’s market-pleasing comments followed by only a few hours the PBOC’s policy move. The situation has turned more serious – in China, in global finance and in U.S. markets. Apple’s Thursday cut in earnings guidance was one more important indication of rapidly slowing Chinese demand. That China’s economic slowdown is occurring in the facing of a historic apartment Bubble significantly complicates policymaking. Beijing would surely prefer to cautiously deflate this colossal Bubble. But, at this point, aggressive measures to stimulate China’s economy would further extend the precarious “Terminal Phase” of mortgage and housing excess.

December 31 – New York Times (Alexandra Stevenson and Cao Li): “Unwanted apartments are weighing on China’s economy — and, by extension, dragging down growth around the world. Property sales are dropping. Apartments are going unsold. Developers who bet big on continued good times are now staggering under billions of dollars of debt. ‘The prospects of the property market are grim,’ said Xiang Songzuo, a senior economist at Renmin University, said… ‘The property market is the biggest gray rhino,’ he said, referring to a term the government has used to describe visibly big problems in the Chinese economy that are disregarded until they start gaining momentum… More than one in five apartments in Chinese cities — roughly 65 million — sit unoccupied, estimates Gan Li, a professor at Southwestern University of Finance and Economics in Chengdu.”

It’s difficult to fathom 65 million vacant apartment units – more than 20% of China’s housing stock. What is the scope of future bad debts and bank impairment associated with such a fiasco? Economic impact – China and globally? Financial ramifications? With a bear market in Chinese equities, China’s vulnerable Bubble Economy and waning global growth, it’s perfectly reasonable for the world to start really worrying about China’s vulnerable apartment Bubble. With all the Friday excitement surrounding Powell and rallying U.S. equities, it’s worth noting that Asian shares underperformed this week. Copper declined another 1.3%.

Along with sinking Treasury and bund yields, there’s ample evidence that something lurking out there is stirring up a palpable degree of angst. And I would like to be more sanguine about U.S. economic prospects, especially considering strong December payroll data. I’m actually not expecting the economy to just fall off a cliff. Tightened financial conditions are a relatively recent development. Barring an accident, it might take some time for faltering markets to feed into the real economy. Yet the U.S. has a Bubble Economy structure unusually vulnerable to deflating securities and asset markets. It also faces perilous structural issues throughout its securities markets and financial system more generally. I certainly believe the U.S. is highly exposed to the unfolding issue of illiquidity afflicting global financial markets.

January 4 – Bloomberg (Rizal Tupaz): “Investors pulled the most money out of investment-grade bond funds in three years last week amid the ongoing turmoil in credit markets. The funds lost $4.5 billion for the weekly reporting period ending Jan. 2, the biggest outflow since December 2015, according to Lipper. That marks the sixth straight retreat by investors. High-yield funds saw a seventh week in a row of outflows as investors yanked $628 million versus the previous period’s $3.9 billion.”

Read More

https://creditbubblebulletin.blogspot.com/2019/01/weekly-commentary-global-markets.html?spref=tw

The Late Cycle Lament: The Dual Economy, Minsky Moments, and Other Concerns – James Montier

Executive Summary : Overoptimism and overconfidence are two well-known psychological traits of our species. They are particularly dangerous in the late stages of an economic cycle where these terrible twins result in investors overestimating return and underestimating risk – a potentially lethal combination of errors. Far from the sanguine consensus of the current state of health of the U.S. economy, in this paper I demonstrate that this is the slowest and weakest recovery in post war history. Whilst GDP growth has been poor, labour productivity growth has been worse, and real wage growth worst of all. The headline data obscure even more worrying trends. Effectively, the U.S. is witnessing the rise of the “dual economy” – where productivity growth is reasonable in some sectors, and totally absent in others. Even in the sectors with good productivity growth, real wages are lagging (wage suppression is occurring). All the employment growth we are seeing is coming from the low productivity sectors. On top of this, the paltry gains in income that are being made are all going to the top 10%. This is not what a booming economy should feel like. Real earnings growth in the corporate sector has been below the rate of GDP growth even after the significant boost from the financial engineering known as buybacks. So investors have little to celebrate. Indeed, a breathtaking 25% to 30% of firms in the Russell 3000 are actually loss-making! Yet the stock market remains well bid. In large part, this bid is sourced from the buybacks (and mergers) from USA Inc. itself. However, individual investors have returned to the “party” – never a good sign. Other portents of late-cycle capitulation include global fund managers throwing in the towel and buying into U.S. equities. The corporate bid is really a massive debt for equity swap, with firms issuing massive amounts of corporate bonds (very low quality debt at that), and effectively leveraging themselves up. This creates a systemic vulnerability, and is potentially a Minsky Moment in the making. The listed sector has been at the vanguard (or perhaps better described as the forlorn hope) of this movement. All of this occurs against a backdrop of an extremely expensive U.S. equity market, which is increasingly looking like Wile. E. Coyote – the hapless adversary of Roadrunner – having run off the edge of a cliff only to realise the ground is no longer below his feet. Tragically, it seems valuation is doomed to suffer Cassandra’s curse at a time when telling the truth is never believed. In order to believe that U.S. equities are going to generate a “normal” return from these levels, you have to believe some quite extraordinary things. Perhaps you believe that P/Es are going to soar to levels not even seen at the height of the TMT bubble; or perhaps you believe that profitability is going to rise (from already extended levels) so that every firm in the U.S. looks like a FAANG stock; or perhaps you believe that growth is simply going to reach unprecedented levels. We, however, are not so prone to flights of fancy that require multi standard deviation outcomes. Unless you believe one of these extreme scenarios, you should be skeptical about the ability of the U.S. market to continue its outstanding performance. Ask yourself how much exposure you have to the U.S. stock market. Then ask yourself what is the minimum amount you could own. We at GMO own essentially zero in our unconstrained portfolios, but then again we are used to career risk and would rather run it than allocate to such an expensive and risky asset.
https://www.gmo.com/docs/default-source/research-and-commentary/strategies/asset-allocation/the-late-cycle-lament-the-dual-economy-minsky-moments-and-other-concerns.pdf?sfvrsn=3

Charts That Matter- 30th dec

We know nothing worked in 2018 with 93% of assets giving negative returns. There were still few exotic winners

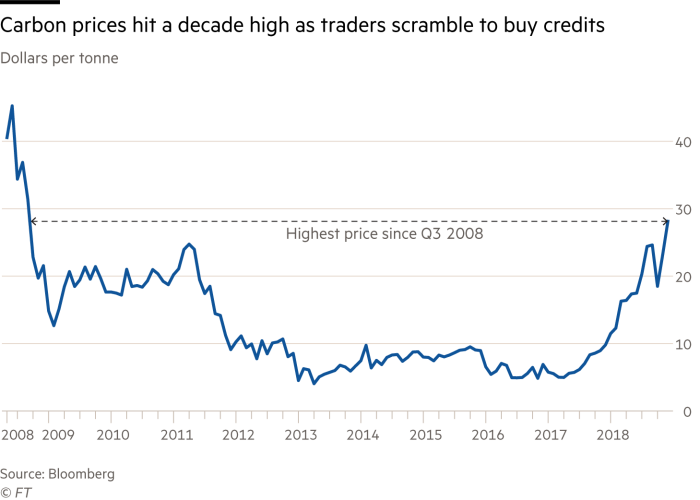
Carbon Credits

The prices had languished for a long time before some tweak by European commission led230 per cent rally in the price between the start of the year and September, which took the allowances to a 10-year high above $25 a tonne.

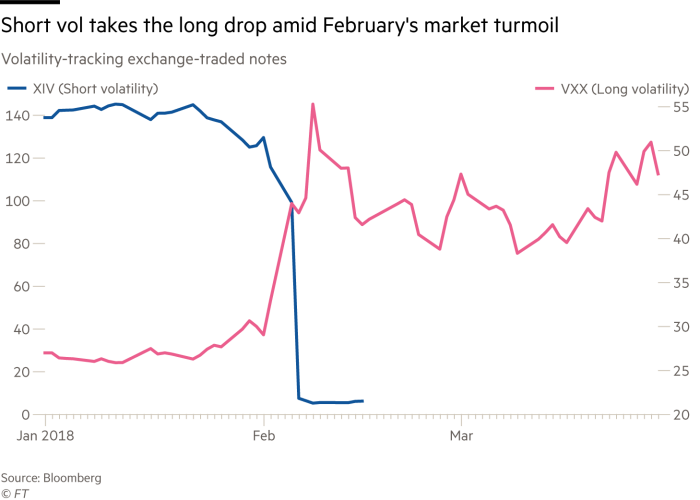
Volatility
VXX the ETN tracking volatility was up more than 50% this year and short volatility ETF XIV lost 90%

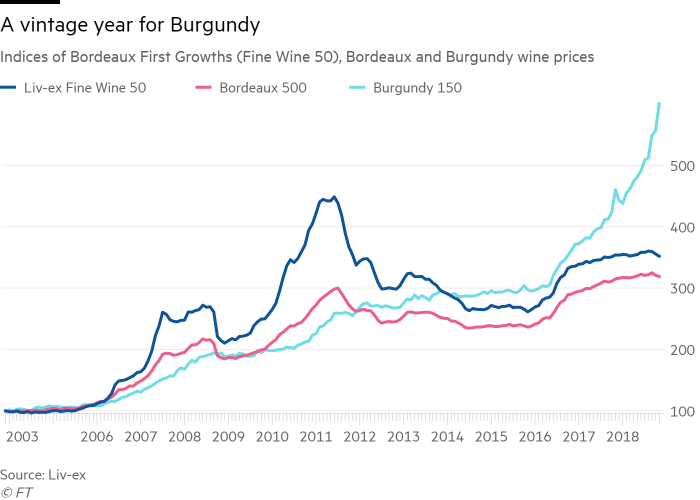
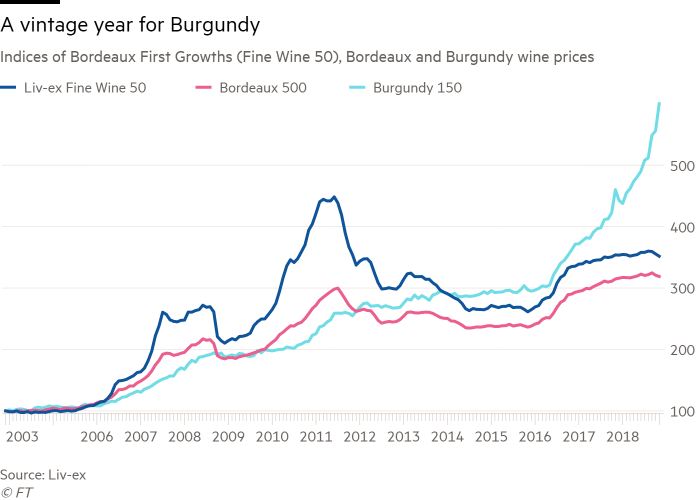
Burgundy wine
Wine traders can toast a vintage year for Burgundy prices in 2018, as this niche corner of the fine wine market surged to record highs.Burgundy 150 index has surged 35.52 per cent, its best performance in a decade

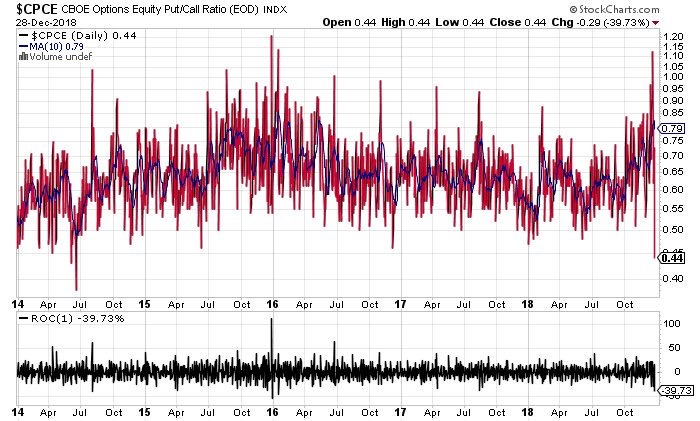
Equity put call drops to the lowest level in 4 years. It seems everybody bought the F….ing dip this Friday.

So much for Bearishness

Thoughts on LIQUIDITY

Doug Noland writes

“Money” challenged – and often confounded – economic thinkers for centuries. It functions as both as a “medium of exchange” and “unit of account.” Simple enough. Too often the focus has been how to use money to stimulate economic activity and achieve political gains. From my perspective, money’s importance lies with its fundamental roles as a “Store of Value” and the bedrock of financial systems. Unsound money has been a root cause of a lot of turmoil throughout history – including the monetary fiasco that collapsed in 2008. Yet concerns for the soundness of contemporary “money” these days are viewed as hopelessly archaic.

My thinking on contemporary “money” has been adapted from a much earlier focus on money’s “preciousness.” Traditionally, money was precious either because it was made of or backed by gold/precious metals. It retained preciousness only so long as its quantity remained carefully contained. Throughout history, the value of “paper money” has invariably moved inversely to the quantity issued – fits and starts, enthusiasm and revulsion and, too often, a path to worthlessness.

Today, “money” is largely electronic/digitized IOUs/Credit – but a special kind of Credit. Money is a perceived safe and liquid store of (nominal) value. This perception assures essentially insatiable demand. Unlimited demand creates a powerful propensity for over-issuance. Historically, monetary inflation ensured the Scourge of Inflationism. Monetary excess distorted flows to goods markets, setting in motion problematic inflationary dynamics in incomes, spending patterns and economic structure.

Despite money’s critical role within an economy, a consensus view on how best to define, monitor and manage the “money supply” escaped both the economics community and policymakers more generally. Too often, politics and ideology muddied already murky analytical waters. What is money these days, and how best to manage monetary matters? Does anyone even care – so long as the securities markets are strong?

If issues surrounding “money” aren’t confusing enough, how about this thing we refer to as “Liquidity.” As we wrap up a wild year in global markets, it would be fitting to label 2018 “The Year of Liquidity.” The year began with a bang, as liquidity inundated the emerging markets. It’s easy to forget that the Shanghai Composite jumped 5.3% in January. Brazil’s Ibovespa surged 11.1% in January and was up almost 15% by late February. The emerging market ETF (EEM) had jumped 10.5% by January 26th. South Korea’s KOSPI index rose 4.0% in January, and India’s Sensex gained almost 6%.

One could reasonably assert that “Liquidity” was in great abundance – in EM and global markets well into 2018. “Money” was flowing readily into the emerging markets, although it would be more accurate to state “finance” was flowing. Speculative Credit was most certainly expanding rapidly, as “carry trades” and a multitude of derivatives strategies funneled newly generated purchasing power into “developing” markets and economies. To be sure, the perception of a world awash in “Liquidity” ensured a problematic buildup of speculative leverage.

In general, free-flowing Credit is inherently self-reinforcing and validating (ongoing expansion supporting the perceived creditworthiness of the existing Credit structure) – hence unstable. Credit for securities speculation – speculative leveraging – is acutely unstable. The expansion of speculative Credit creates a flow of buying power, or Liquidity, that inflates securities prices and engenders only greater demand for speculative Credit. Resulting Liquidity abundance fosters confidence that markets will continue to boom skyward. “Money” everywhere.

The expansion of GSE Credit was key to the perception of Liquidity abundance early in the mortgage finance Bubble period. The expansion of GSE liabilities generated a powerful flow of buying power/Liquidity into the marketplace. Moreover, the ability and willingness to aggressively expand GSE Credit in the event of heightened market stress fostered the perception that a governmental quasi-central bank entity was available to backstop system liquidity when needed. By late in the cycle, a booming Credit expansion was creating such a prodigious flow of Liquidity that markets had little concern that fraud at the GSEs essentially eliminated their capacity to backstop market Liquidity.

Simplifying the analysis, we can consider four key – and interrelated – elements to market “Liquidity.” First, the actual purchasing power (i.e. deposits, money market funds, etc.) available to purchase securities. Second, the ease of availability of speculative Credit for the leveraging of securities. Third, the willingness and capacity of market-makers and operators to accumulate holdings in the face of intense selling pressure. And, fourth, the perception of Liquidity flows that could be injected into the system in the event of market instability and illiquidity risk (GSE backstop bid during the mortgage finance Bubble – and central bank QE throughout the global government finance Bubble).

M1 money supply ended last week at $3.736 TN, with M2 at $14.415 TN. M2 is a rather straightforward calculation adding Currency, Deposits (checking/saving/small time/other) and Retail Money Market Funds. The Federal Reserve in the past calculated M3, a broader measure of money (adding large time deposits, institutional money funds and repurchase agreements). Long arguing that broad “money” was analytically superior to the narrow aggregates, I nonetheless lost no sleep when the Fed discontinued publishing its M3 aggregate (still too narrow!). Our analytical frameworks should strive to incorporate the broadest view of “money,” Credit and “finance,” although the broader the view taken the more challenging the analysis.

I would posit that some time ago Liquidity completely supplanted the monetary aggregates as the key focal point of market flow analysis. Unfortunately, there is no quantity of “Liquidity” to measure and tabulate. I am not familiar with an adequate definition or even common understanding. The concept of contemporary “money” has proved highly problematic for the economics community. Yet Liquidity makes “money” appear quite straightforward. If it can’t be defined or calculated, it’s certainly not worthy of inclusion in econometric models.

Liquidity is an amalgam of real financial flows and intangible market perceptions. There is no aggregate that would signal whether Liquidity is either expanding or contracting. Even if overall Liquidity was viewed as either abundant or deficient, there would still be widely divergent Liquidity manifestations for individual sectors, markets, countries or regions. And how can seeming Liquidity overabundance so briskly transform into illiquidity?

“Money supply” was an invaluable tool for gauging system “Liquidity” back when bank liabilities (i.e. deposits) were the prevailing mechanism for money and Credit expansion. Analysis has changed profoundly with the globalized adoption of non-bank market-based Credit. I have argued that market-based Credit is highly unstable – speculative Credit perilously so. I would contend that “Liquidity” is typically steady but at times highly erratic. So long as the global Credit boom continues, speculative Credit expands, and markets remain stable, the perception of Liquidity abundance ensures ample purchasing power to sustain the bull market. But the Wildness Lies in Wait.

For years now, global central bank policies have been fundamental to the perception of uninterrupted Liquidity abundance. Chairman Bernanke’s zero rates and QE measures caused a historic flow of purchasing power (Liquidity) into stock and fixed-income funds. This evolved into a momentous shift of financial flows into “passive” risk market strategies (perceived as low-risk and, often, money-like). Ultra-low rates and the belief that central banks were backstopping market Liquidity fundamentally altered both the flow of Liquidity and, over time, the structure of the marketplace.

The flow of Trillions into ETF and other “passive” strategies changed the nature of global leveraged speculation. Not only were the leveraged speculators incentivized by near zero (and even negative) borrowing costs and confidence in the central bank Liquidity backstop, they were now emboldened by the predictability of huge “retail” flows into stock (domestic and international) and fixed-income funds. Booming flows into equities and bonds fundamentally loosened financial conditions on an unprecedented global basis.

Loose finance stoked asset inflation, booming M&A and buybacks, all conducive to economic expansion and surging corporate profits. Liquidity circulating briskly throughout both the Financial and Economic Spheres bolstered the perception of an endless Liquidity boom. Booming securities markets fueled U.S. consumption and ongoing huge trade deficits, dollar Liquidity flowing out to the world – only to be recycled right back into U.S. securities and asset markets (i.e. EM central bank purchases, hedge funds borrowing in offshore markets to leverage in U.S. securities, Chinese buying U.S. Treasuries and real estate, etc.). Meanwhile, booming global markets and the ease of “investing” passively through the ETF complex stoked unprecedented U.S. flows to global markets – once again generating a flow of global Liquidity that would be readily “recycled” back into U.S. markets.

Early CBBs introduced the concept of the “infinite multiplier effect.” Contemporary finance (largely devoid of capital and reserve requirements) left the old fractional reserve banking deposit “money multiplier” in the dust. The flow of purchasing power/Liquidity would circulate and recirculate, in the process fueling both unfettered Credit expansion and asset inflation. The global government finance Bubble period – with its zero rates, Trillions of new “money,” and central bank liquidity backstops – has seen the “infinite multiplier” at work on an unprecedented global scale. Liquidity created by the central banks, as well as through massive government debt expansion and leveraged speculation, has circulated freely on a global basis, inflating securities/asset prices, stoking economic expansion and promoting a self-reinforcing perception of endless Liquidity.

For the most part, contemporary market Liquidity is not real. It’s primarily a market perception. It’s based on the view that financial flows into markets will remain positive and, on those rare occasions when they’re not, central banks will step in and ensure “money” flows unabated into the financial markets. It’s based on confidence and faith – in contemporary central banking, in market structure, in the derivatives complex, in modern technologies and ingenuity. It’s based on the view that global Credit will continue to expand, premised on confidence that Beijing will ensure ongoing Credit expansion and that U.S. Credit is fundamentally robust. It’s based on the overarching belief that global finance is fundamentally sound, policymakers possess acumen and enlightenment, central bank power is boundless, and the global economy is on solid footing.

I believe the February blow-up of “short vol” strategies was a key initial crack in the global Bubble. Huge speculative excess had accumulated in a major market used for acquiring protection against market declines – writing “flood insurance” during a protracted central bank-induced drought. Abrupt market losses and illiquidity changed the risk/reward calculus for “selling” market “insurance” – reducing the supply and increasing the price of protection. Not long after, indications of fledgling risk aversion began to beset the global “Periphery.” EM Liquidity began to wane, an especially problematic dynamic following a speculative blow-off period. As EM flows reversed, de-risking/deleveraging dynamics took hold. Liquidity that seemed so abundant early in the year suddenly disappeared, replaced by faltering markets, dislocation and fear of expanding market illiquidity throughout the “Periphery.”

On a global basis, the Liquidity backdrop had changed momentously. For the first time in several years, a significant de-risking/deleveraging dynamic was unfolding without the benefit of huge central bank QE liquidity injections. Rapid currency collapses in Turkey and Argentina signaled a critical global Liquidity inflection point. And as de-risking/deleveraging gained momentum, Contagion became a major concern. China and Asia, the epicenter of Liquidity excesses over this cycle, saw their currencies, equities and bonds fall under significant pressure. Dollar-denominated debt, having so flourished during Liquidity abundance, was suddenly facing sinking prices and Liquidity issues. The shifting Liquidity backdrop was also manifesting in the colossal international derivatives markets (i.e. currency, swaps and fixed-income).

Market perceptions with regard to international Liquidity changed meaningfully. The same could not be said for the U.S. If anything, expectations for ongoing Liquidity abundance became only more deeply ingrained. Keep in mind that the Federal Reserve concluded QE operations in 2014. With the bull market having not missed a beat, it was widely believed that QE was irrelevant for the U.S. Not appreciated was the major role QE was having on international Liquidity, with “money” created by the ECB, BOJ and others finding its way into U.S. securities markets and the American economy. This year’s instability at the “Periphery” then initially exacerbated flows to “Core” U.S. markets, pushing already highly speculative markets into Melt-Up Dynamics.

From a Liquidity perspective, speculative blow-offs are highly problematic. A bout of manic buying and leveraging culminates in highly elevated and unsustainable prices and financial flows. The perception of Liquidity abundance sows the seeds of its own destruction. When prices inevitably reverse, the onset of de-risking/deleveraging dynamics ensures a highly problematic Liquidity environment.

When the Crowd is fully on board, who is left to buy? When the leveraged speculating community reverses course, who but central banks have the capacity to accommodate deleveraging? If a significant segment of the marketplace moves to hedge market risk, where is the wherewithal to shoulder such risk? And let’s not overlook the critical issue of market risk shifting to speculators and traders expecting to dynamically-hedge option risk written/sold in the marketplace (planning, when necessary, to establish short positions in a declining marketplace). Current Market Structure ensures serious Liquidity issues upon the inevitable bursting of speculative Bubbles. Who wants to get in front of the algos?

Progressively more reckless central bank measures over the past decade have been necessary to promote the perception of ample and sustainable Liquidity. But with Crisis Dynamics having recently afflicted the “Core,” it is difficult for me not to see a Liquidity environment fundamentally altered. Confidence has taken a significant hit. I believe the leveraged speculating community has been impaired, with outflows and general risk aversion ensuring ongoing de-risking/deleveraging. Similarly, with confidence in “passive” (stock, fixed-income, international) ETF strategies now badly shaken, it is difficult to envisage a return to booming industry inflows. And with derivatives players stung by abrupt market losses and a spike in volatility (option premiums), I expect we’ve passed a critical inflection point in the pricing and availability of market protection.

The backdrop points to an inhospitable Liquidity backdrop. Serious market structural issues have bubbled to the surface, issues market participants either haven’t appreciated or simply believed would readily rectify by central banks before confidence was impacted. The orientation of powerful financial flows has been upset. Hedging and derivatives markets have dislocated. The great fallacy of “moneyness” for risky stocks, bonds and derivatives is being laid bare.

Importantly, I view speculative Credit as the marginal source of global Liquidity. I believe a historic Bubble in securities and derivatives-related Credit has been pierced. This Bubble was fueled by years of zero/negative rates and Trillions of central bank liquidity. As we saw this week, bear market rallies tend to be ferocious. And when a short squeeze and unwind of hedges is in play, surging prices will spur hope the sell-off has run its course and that Liquidity has returned to the markets.

It’s just not going to be that simple. Global markets face serious structural issues years and decades in the making. Hopefully markets can avoid crashes and make necessary adjustments over an extended period of time. For a while now, I’ve feared a scenario where illiquidity becomes a systemic global issue. From closely analyzing previous booms and bust episodes, things often prove even worse than I suspect.

Read Full article below

http://creditbubblebulletin.blogspot.com/2018/12/weekly-commentary-thoughts-on-liquidity.html