Charts That Matter- 29th dec

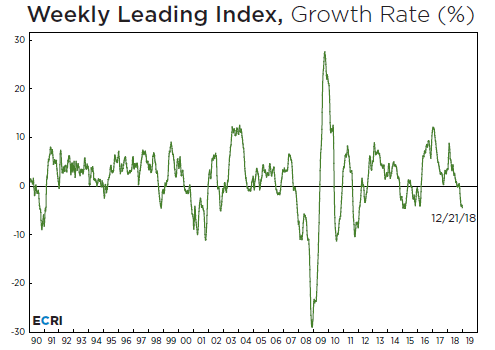
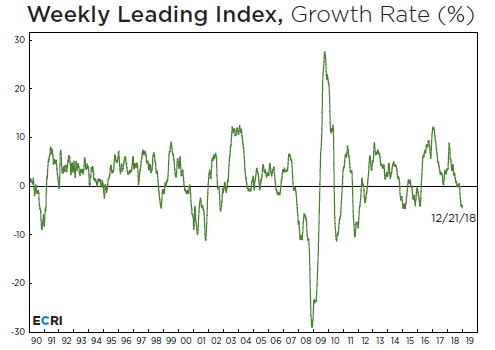
ECRI’s U.S. Weekly Leading Index (WLI) fell to 144.7 as WLI growth decreased to -4.4%, a 199-week low.

(The WLI is one of many ECRI leading indexes, including some with longer leads over cyclical turning points in economic growth)
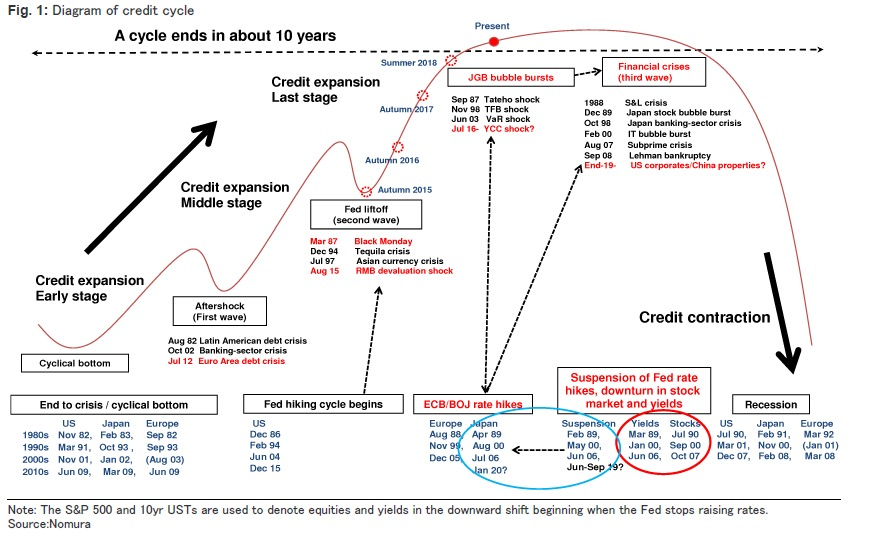
A cycle ends every ten years…. one ending now – Nomura
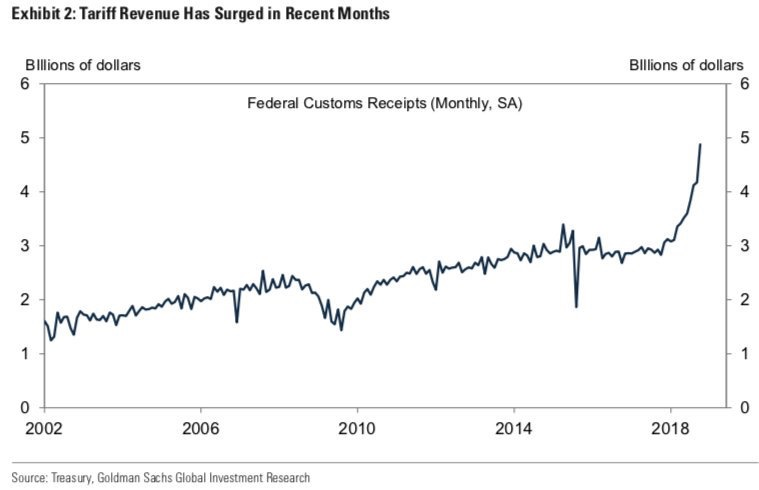
Tariff Revenue Has Surged in Recent Months (tariffs are stealth taxes on broke consumers)
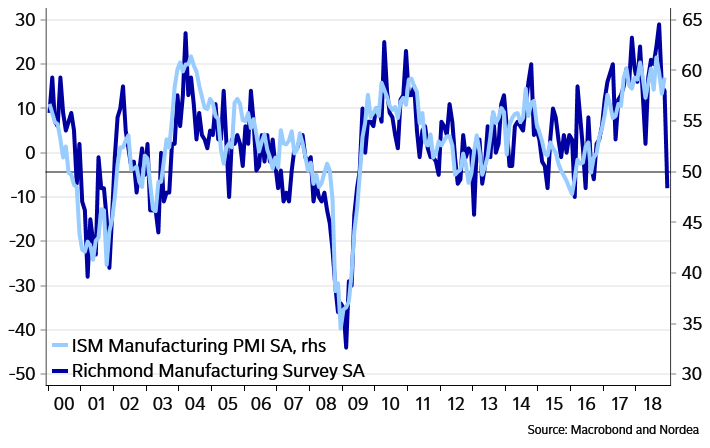
Would you want to tighten more given these charts?
The Richmond Fed is not the only indicator that points to below-50 readings in the ISM index ( below 50 is sign of contraction)three to five months from now – financial condition indices point in the same direction. Would you tighten further if you were the Fed and looked at these charts? At least it becomes much trickier than otherwise. Even though the ISM is not a particularly precise indicator of US GDP trends, it is worrisome if the ISM index drops as swiftly as indicated by some of our models by now.( Nordea)
2019 outlook I wish I had written…..

Raul writes his outlook for 2019 and this was precisely the view I would have put across ………

“That’s where the Fed is now. You can let interest rates rise, as Powell et al are indicating they want to do, but that will cut off debt growth, and since debt is exclusively what keeps the economy going, it will cut into economic growth as well. Or you can keep interest rates low (and lower), but then people have less and less idea of the actual value of assets, which can, and eventually necessarily will, cause people to flee from these assets.
Powell’s rate hikes schedule looks nice from a normalizing point of view, and g-d knows what normal is anymore, but it would massacre the zombie markets the Fed itself created when it decided to kill the actual markets. You can get back to normal, but only if the Fed retreats into the Eccles Building and stays there until 2050 or so (or is abolished).
They won’t, the banks whose interests they protect will soon be in far too dire straits, and bailouts have become much harder to come by since 2008. It’ll be a long time before markets actually function again, and we won’t get there without a world of pain. Which will be felt by those who never participated in the so-called markets to begin with. Beware of yellow vests.”

Read full article

https://www.theautomaticearth.com/2018/12/2019-zombie-markets-before-the-fall/

Charts That Matter- 27th dec

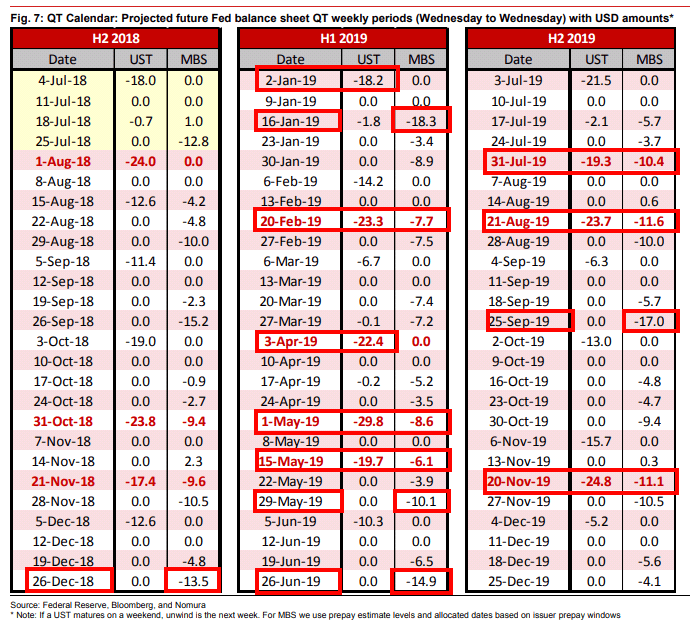
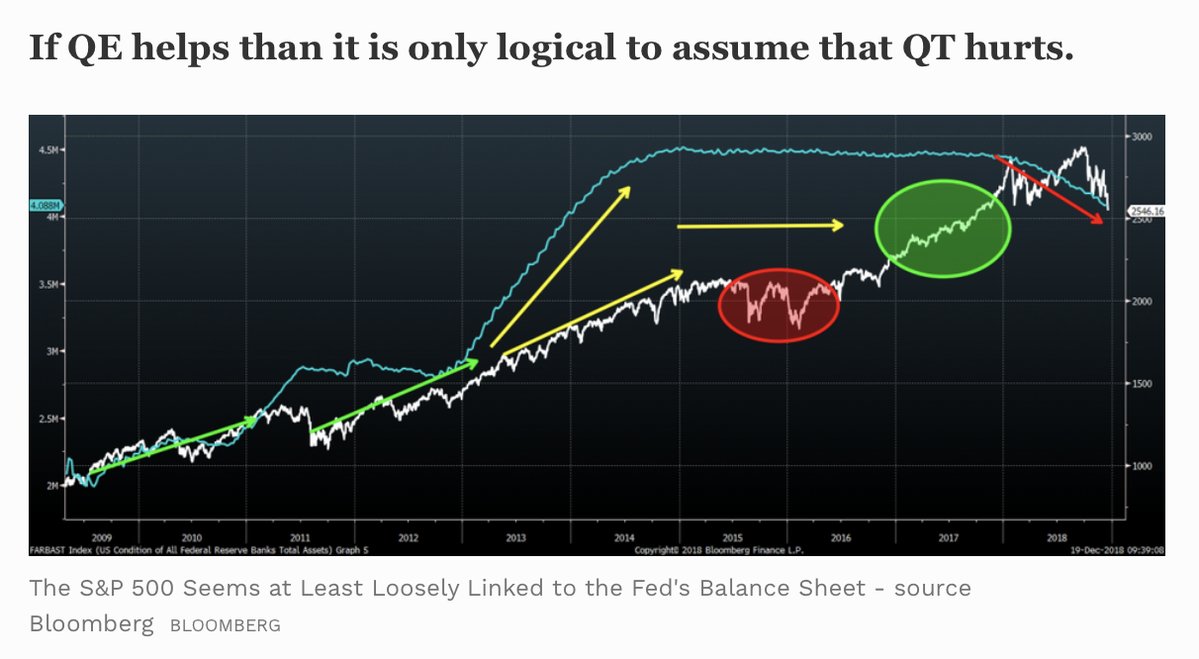
There is a direct correlation between QT days and performance of stock market on those days. The week in which FED does QT are normally negative for US stock markets and we have two big ones coming in January

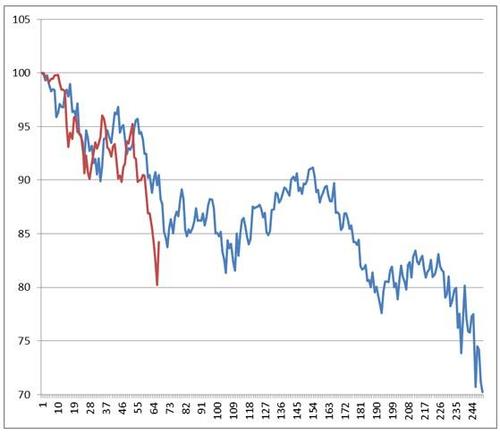
The bear market analog courtesy of McElligott at Nomura. This chart tells the story, while we are in a bear market, we are oversold and odds are the market will spend months consolidating this December 2018 market drop.

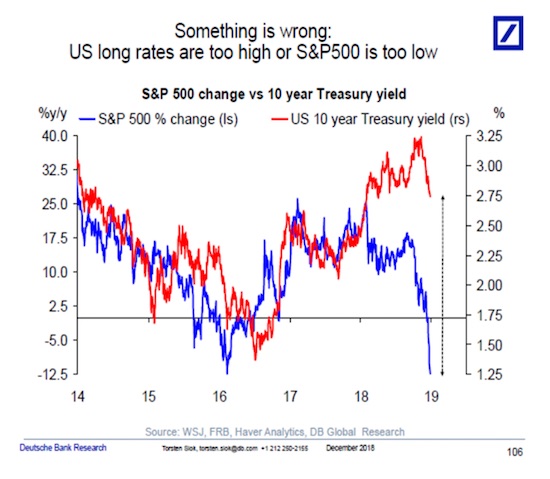
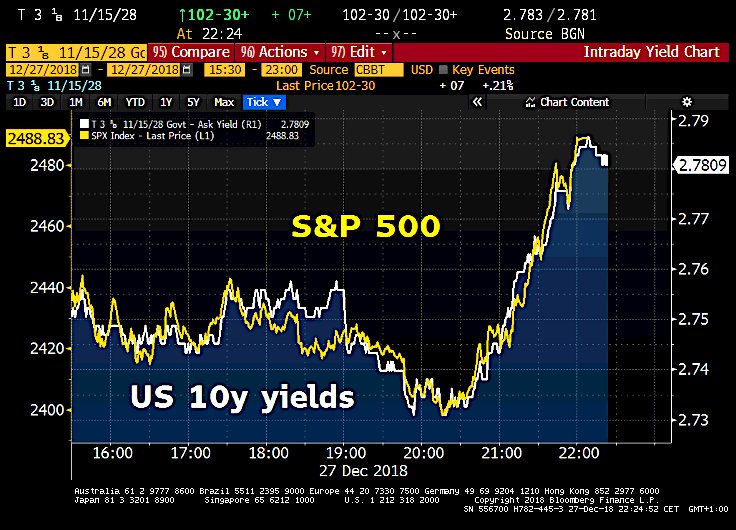
Stocks and bond yields trade in lock-step, suggesting widely anticipated large month-end and quarter-end pension rebalancing flows. S&P 500 erases 2.8% drop in biggest reversal since 2010, while US 10y yields initially had fallen to 2.73% before climbing back to 2.78%.

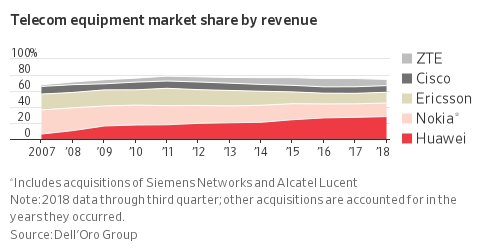
These charts explain how China’s Huawei took over the world

Nomura’s McElligott Tells You ‘Why We’re Here’ And Where He Thinks We’re Going

McElligott of Nomura writes in a note …..how the calendar and thin liquidity are together contributing to wild price action before again suggesting that January could be better.

“This seizure-like behavior isn’t endearing risk-taking in the final days of 2018, despite panicking some who are always under the grasp of FOMO, however, my belief of ‘the January effect’ is alive and well on the buy-side, with many PMs stating to me that they plan to significantly gross-up both longs- and shorts- as the calendar turns”, Charlie writes, adding that his view “continues to be that we will see powerful risk-rallies in standard bear-market fashion in the coming-months which ‘traders can trade’.”
That said, this is all “for rent” – so to speak. “In time [these] will be faded 1) as long as the Fed continues with normalization and 2) against the backdrop of the simple realities of the late-stage business cycle”, he continues, before warning that similar to October, January is set to be another large “QT month” as “the Fed’s balance sheet run-off continues including two heavy weekly QT periods during the first- and third- weeks of January along with [next month] being the first month following the cessation of the ECB’s bond-buying program.”

As far as the broader macro backdrop, McElligott notes that the stage still appears set for the U.S. econ to come in weak. The catalysts are familiar and include steady real yields despite the bleed in breakevens, the waning of the fiscal impulse, the lagged wealth effect from plunging stock prices and “the cyclical reality of corporate deleveraging which inherently means lower CAPEX.”
With all of the above in mind, the environment is conduce only to tactical trading, with directional expressions stuck in suspended animation and conviction lacking until we get a definitive sign from the Fed

In Defense of the Fed

Stephen Roach writes…..

Despite howls of protest from market participants and rumored threats from an unhinged US president, the Federal Reserve should be congratulated for its commitment to normalizing interest rates. There is simply no other way to break the US economy’s 20-year dependence on asset bubbles.

The Fed, it is to be hoped, is finally coming clean on the perils of asset-dependent growth and the long string of financial bubbles that has done great damage to the US economy over the past 20 years. Just as Paul Volcker had the courage to tackle the Great Inflation, Jerome Powell may well be remembered for taking an equally courageous stand against the insidious perils of the Asset Economy.

It is great to be a fan of the Fed again.”

Read More

https://www.project-syndicate.org/commentary/federal-reserve-right-to-raise-interest-rates-by-stephen-s–roach-2018-12

You Owe $86,000 per Person in your Household- Pay up now

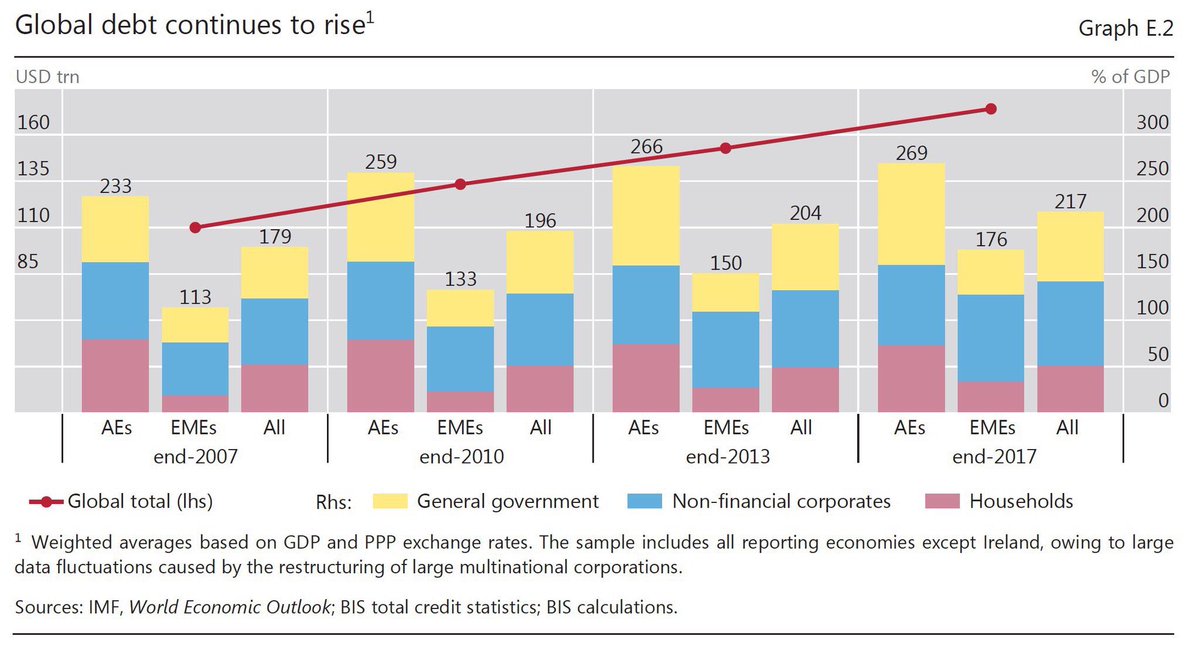
Martin Armstrong writes….The total global debt hit a record $184 trillion, which is the equivalent to more than $86,000 per person. That is actually more than double the average per-capita income. People ask me will our solution work? Can we really just end government debt and convert it to cash restricted to investing in domestic companies? I will put it this way. There is absolutely NO OTHER CHOICE!!!!


We either default, which will result in civil war and revolution, or you inflate your way out like Venezuela so your Social Security check will not even buy a cup of coffee. A default will result in war. People will then riot demanding they have been cheated. Inflating the way out is completely different. You paid them what was promised. It’s not your fault it buys nothing.
To inflate the way out requires a completely different set of patterns. Right now, the theory is that WE THE PEOPLE are the problem. If we all paid what the government thinks we should then they will be fine. They increase taxes and increase enforcement and believe it is their divine right of kings to act in this manner. What we are witnessing so far is not the inflation path – but the hardline path that leads to only violence as we are witnessing in France.

Charts That Matter- 26th dec

Profit expectations are unraveling. India, perhaps the biggest emerging-market favorite of global money managers, is missing earnings projections by almost 15 percent. China, the world’s second-biggest economy, is trailing by 17 percent. Six other markets including South Korea and Mexico are falling short by more than 20 percent.
There are handful of outperformers, but they’re countries where analysts typically give cautious projections, such as Russia and Argentina, because a seemingly endless stream of trouble makes predicting earnings difficult.

Among 30 emerging markets, 16 trade at a standard deviation above the 10-year mean. In other words, companies are earning more profit for each dollar of their share price. Returns from Argentina are almost three standard deviations above normal, the best value-for-money across the emerging world. India stands at Bottom

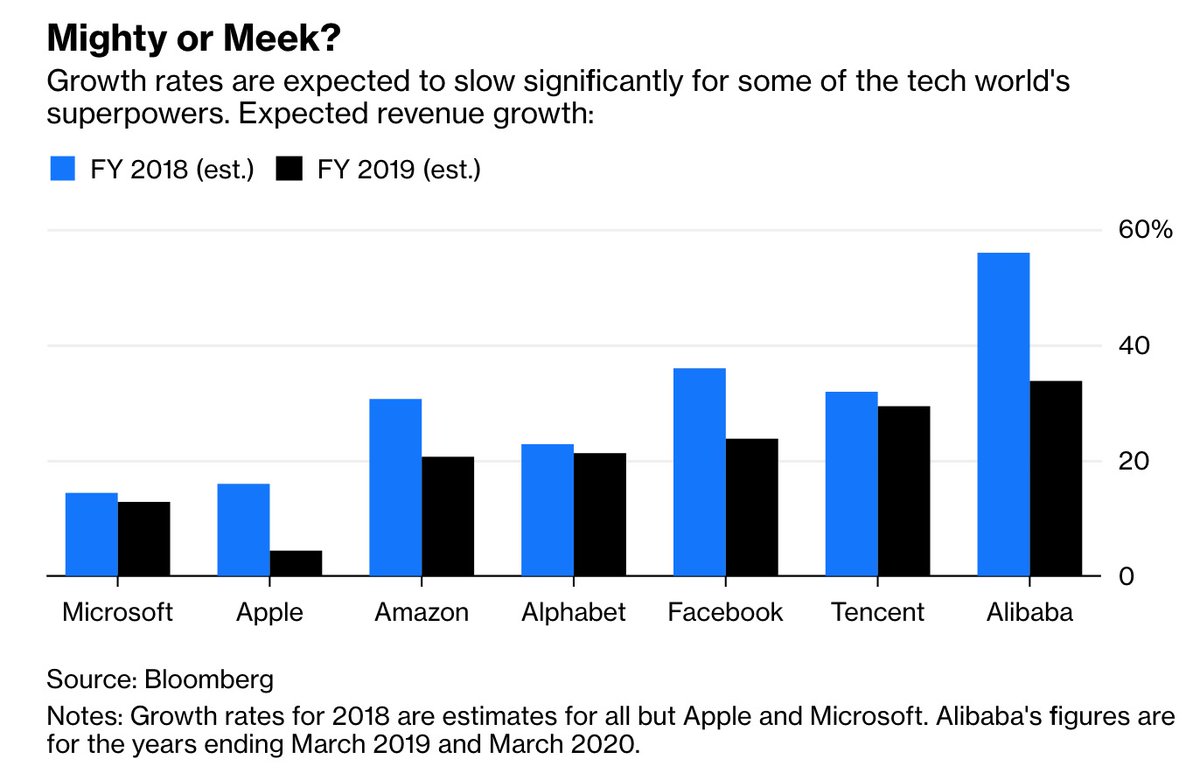
Growth rates are expected to slow significantly for some of the tech world’s superpowers. Disillusionment and promise in a whirlwind year.

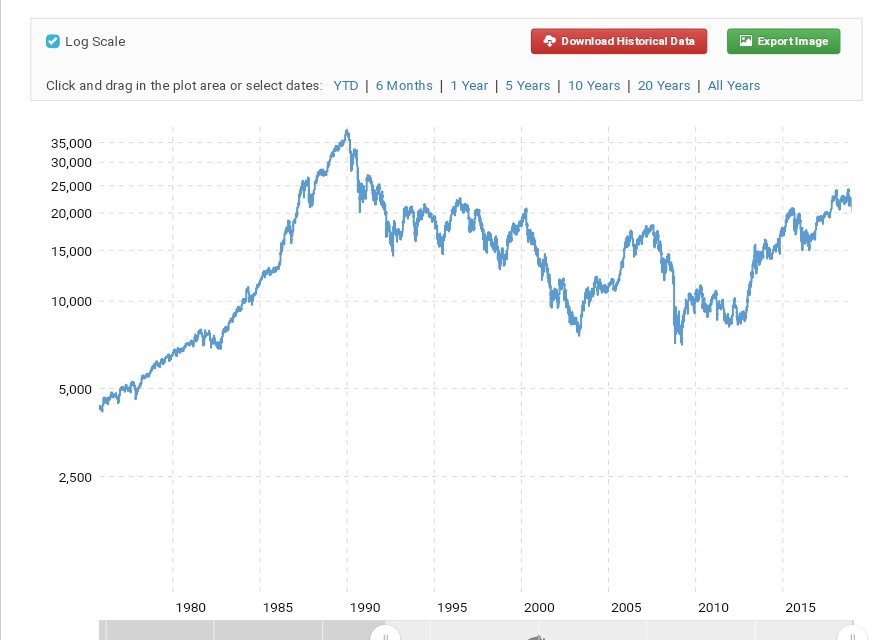
Time In Market More Important Than Timing The Market…..ask Japanese investors
The Japanese Index (Nikkei 225) chart is terrifying.This is 50 years. It’s been 30 years since a new high.

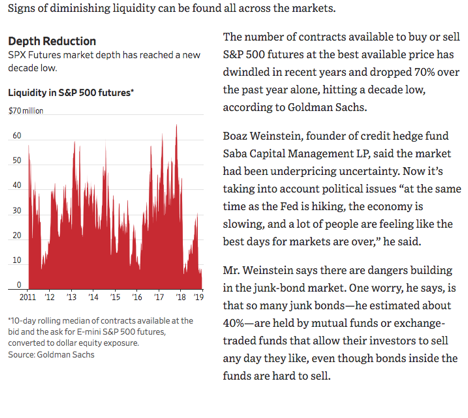
The impact cost is going up and if you are in large AUM funds then it you, investor who is paying for it.

Charts That Matter- 25th Dec

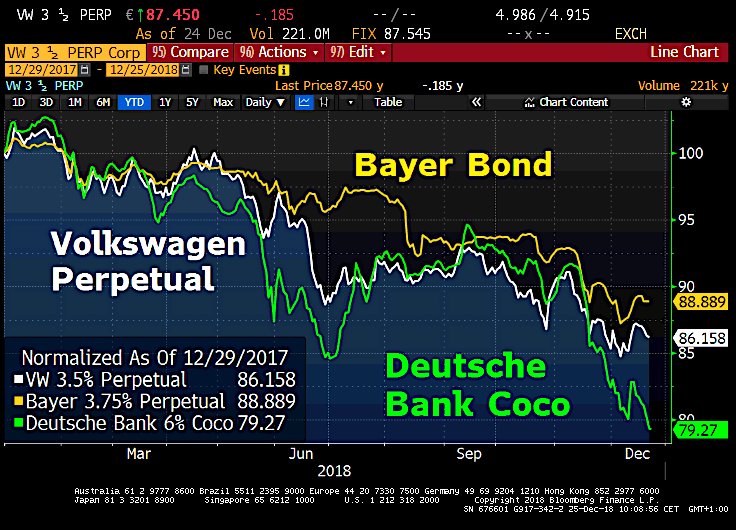
Bond market is showing the challenges Germany face. The bonds from VW, Bayer & Deutsche Bank have plunged because investors have lost confidence in the companies. Bayer suffers from Monsanto takeover, VW from emissions scandal, DB from continuous scandals (holger)

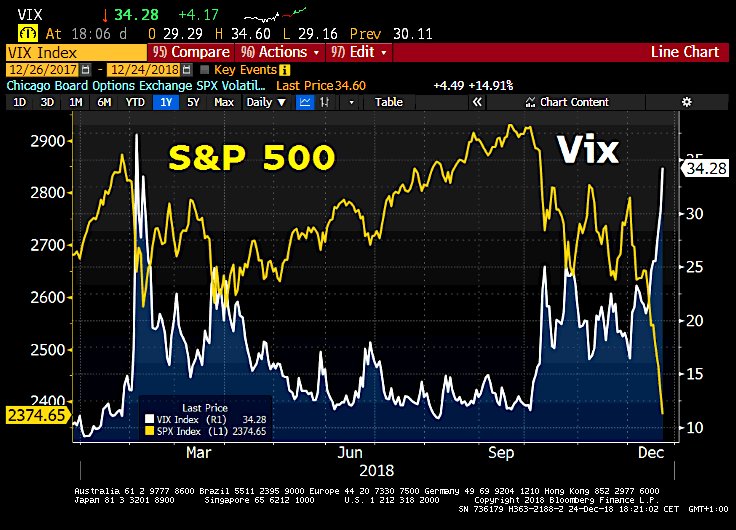
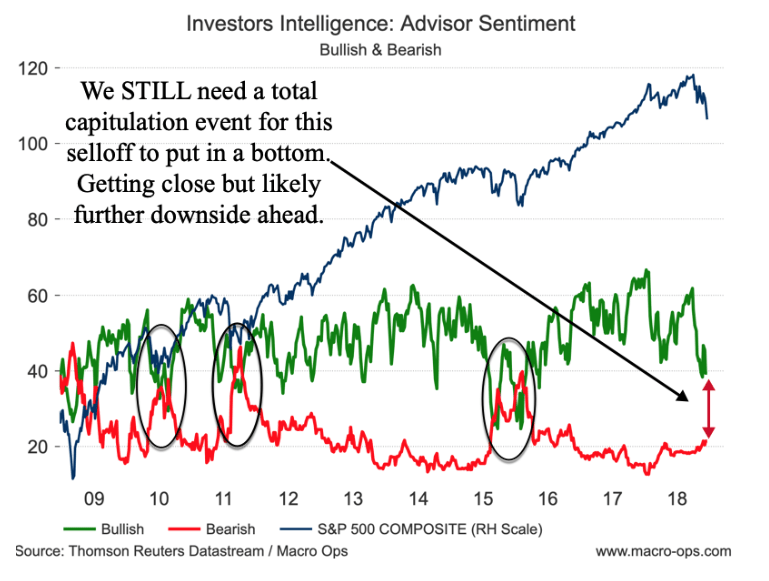
Fear Index Vix jumps by 15% as stock market rout deepens w/ S&P plunges to lowest level since May2017.Daily sentiment Index for equities is at 4 and bond at 93…. extreme not seen for a long time

The World Will Pay for Not Dealing With Debt: Inventive policymaking has only made the problem worse, guaranteeing that any eventual restructuring will be all the more painful. US is best placed with almost 50% of their debt held by foreigners. Just Inflate away the debt

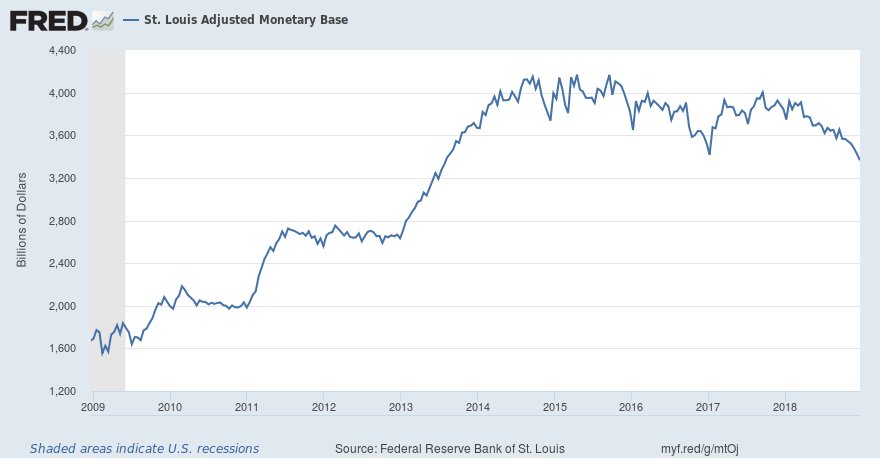
While everyone wants to discuss interest rates, the impact of balance sheet reduction may be more important than hikes and if that isn’t addressed, expect more volatility and stock market problems.

Adjusted monetary base drops by $57 billion over two weeks to $3.365 trillion, the lowest level since July 2013.
LIQUIDITY MATTERS

Market Update