Doug Noland writes……
February 8 – Bloomberg (Brian Chappatta): “Bond traders are dusting off their tried and true post-crisis playbook after the Federal Reserve’s pivot last month. What they don’t realize is that the game has most likely changed. In an unabashed reach for yield, investors suddenly can’t get enough of the riskiest debt, with the Bloomberg Barclays U.S. Corporate High Yield Bond Index posting a staggering 5.25% total return in the first five weeks of 2019, led by those securities rated in the CCC tier. In the largest CCC borrowing since September, Clear Channel Outdoor Holdings Inc. received orders this week of more than $5 billion for a $2.2 billion deal, allowing it to price its debt to yield 9.25%, compared with whisper talk of about 10%.”
A Friday headline from a separate Bloomberg article: “Corporate Bonds on Fire as Dovish Fed Soothes Investors,” with the opening sentence: “Fear is turning to exuberance in credit markets.” According to Lipper, corporate investment-grade funds enjoyed inflows of $2.668 billion last week, with high-yield funds receiving $3.859 billion. Bloomberg headline: “High-Yield Bond Funds See Biggest Inflow Since July 2016.” This follows the highest high-yield inflows ($3.28bn) since December 2016 from two weeks ago.
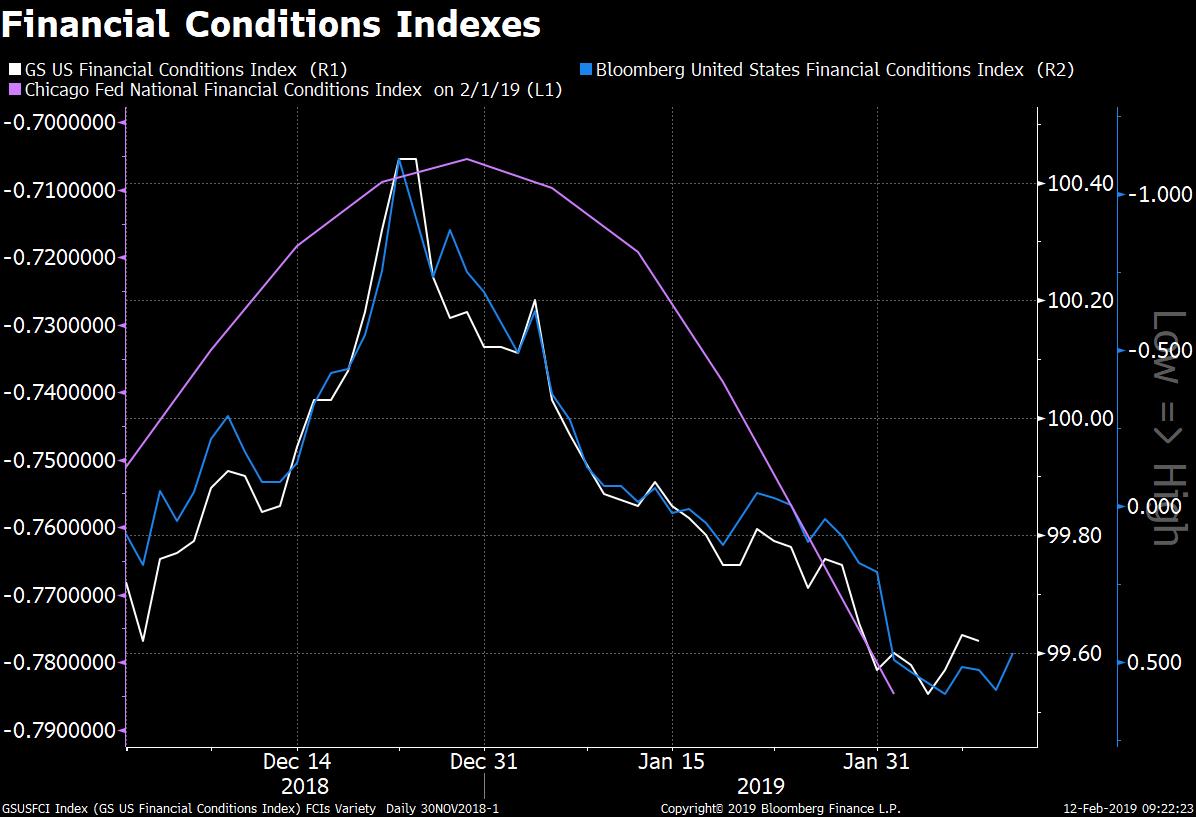
There’s support for the argument that financial conditions have loosened significantly over recent weeks. Prices of corporate bond default protection have declined. After trading as high as 95 bps on December 24th, by Tuesday an index (Markit) of investment-grade credit default swap (CDS) prices had dropped all the way back to 64 (near October levels). Risk premiums have narrowed, especially for high-risk junk bonds. U.S. high-yield spreads (Bloomberg Barclays) traded as wide as 537 bps on (tumultuous) January 3rd. By this Wednesday they were back down to 400 bps (still significantly above the 300bps from October 3rd).
Bank bond CDS prices have retreated. After spiking to 129 bps on January 3rd, Goldman Sachs CDS was back down to 82 bps on Tuesday (closed the week at 89). For perspective, GS CDS traded at 55 on the final day of July and 59 bps on October 3rd. After trading to 218 bps on January 3rd, Deutsche Bank CDS was back down to 167 bps by the end of January (ended Friday at 189bps)
February 8 – Reuter (Marc Jones): “Investors pumped record high volumes of cash into emerging markets shares and bonds in the past week, Bank of America Merrill Lynch (BAML) said on Friday amid expectations U.S. monetary policy could lead to a weaker U.S. dollar… Investors have piled into emerging market equities and bonds in recent months amid expectations that the U.S. Federal Reserve will not raise interest rates as quickly as previously expected or even no longer tighten its policy.”
February 7 – Reuter (Marc Jones): “A ‘wall of money’ is set to flood into emerging markets assets now the U.S. Federal Reserve has eased the risk of a sharp rise in global borrowing costs, the Institute of International Finance (IIF) said… The IIF, which closely tracks financing flows, said its high frequency indicators were picking up a “sharp spike” of inflows following last week’s confirmation of a change of tack from the U.S. central bank. ‘Recent events look likely to restart the ‘Wall of Money’ to Emerging Markets,’ IIF economists said in a report.”
Institute of International Finance estimates put January ETF inflows on a quarterly pace of about $50 billion, ‘already equal to strong EM inflows in 2017 and likely to go higher.’”
The MSCI Emerging Market equities index has gained 7.3% y-t-d. So far in 2019, dollar-denominated bond yields are down 828 bps in Venezuela, 36 bps in Indonesia, 34 bps in Ukraine, 33 bps in Saudi Arabia, 31 bps in Russia, 30 bps in Chile, 30 bps in Colombia, and 16 bps in Turkey. Local currency yields have sunk 91 bps in Lebanon, 77 bps in Philippines, 35 bps in Hungary, 35 bps in Mexico and 27 bps in Russia.
With “risk on” back on track, why then would “safe haven” bonds be attracting such keen interest? German 10-year bund yields sank eight bps this week to nine bps (0.09%), the low going back to October 2016. Two-year German yields were little changed at negative 0.58%. Ten-year Treasury yields declined five bps this week to 2.64%, only nine bps above the panic low yields from January 3rd. Japanese 10-year yields declined another basis point this week to negative three bps (negative 0.03%), only about a basis point above January 3rd lows. Swiss 10-year yields declined six bps this week to negative 0.33% – the low since October 2016.
So, who’s got this right – risk assets or the safe havens? Why can’t they both be “right” – or wrong? There is much discussion of a confused marketplace: extraordinary cross-currents leaving traders confounded. In search of an explanation, I’ll point to the consequences of Monetary Disorder.
It has now been a full decade of near zero interest rates globally. Trillions (estimates of around $16 TN) of new central bank “money” were injected into global securities markets. What’s more, global central banks have repeatedly intervened to buttress global markets – from 2008/09 crisis measures; to 2012’s “whatever it takes”; to 2016’s “whatever it takes to support a faltering Chinese Bubble”; to last month’s Powell U-turn. The combination of a decade of artificially low rates, an unfathomable amount of new market liquidity and an unprecedented degree of central bank market support have fostered momentous market structural maladjustment. We’re living with the consequences.
It is certainly not easy to craft an explanation for today’s aberrant market behavior. I would start by positing that a massive pool of speculative finance has accumulated over this protracted cycle. There is at the same time liquidity excess, excessive leverage and the proliferation of derivatives strategies (speculation and hedging). In short, there is trend-following and performance chasing finance like never before – keenly fixated on global monetary policies. Illiquidity lies in wait.
When this mercurial finance is flowing readily into inflating securities markets, the resulting conspicuous speculative excess pressures central bankers to move forward with “normalization” (Powell October 3rd). At the same time, this edifice of speculative finance is innately fragile.
Speculative markets reversing to the downside rather quickly unleash “Risk Off” dynamics. These days, de-risking/deleveraging abruptly alters a market’s liquidity profile. Not only is there the liquidation of holdings and the collapse of leverage, the resulting downward market pressure triggers risk aversion more generally for this imposing global pool of speculative finance. And as the ETF complex suffers outflows, the leveraged speculating community and derivatives industry move to shed risk ahead of a retail investor panic. And when a meaningful component of the marketplace seeks to hedge market risk, it’s difficult to envision who takes the other side of such a trade.
Meanwhile, major shifts in dynamic-hedging programs unfold throughout the derivative universe. When markets are running on the upside, derivative-related buying (i.e. hedging in-the-money call options written/sold) exacerbates already powerful trend-following flows. But when a speculative upside (i.e. “blow-off” or “melt-up”) market advance eventually reverses course, derivative-related buying swiftly transforms into destabilizing selling. For example, a quant model used for (dynamic) “delta hedging” exposures from derivatives previously written (i.e. call options) would halt aggressive buy programs – immediately becoming a seller into market weakness.
Meanwhile, sinking markets will see keen interest in buying downside derivative protection (i.e. puts) – both for speculation and hedging. The sellers of these derivatives will then dynamically hedge these instruments, essentially requiring selling into declining markets. Using out-of-the-money puts options as an example, the amount of selling required to protect the seller/writer of these instruments expands exponentially as market prices approach option strike prices. The point is, derivatives tend to play a significant role in promoting destabilizing upside market moves, dislocations that are then highly susceptible to reversals and destabilizing market breakdowns.
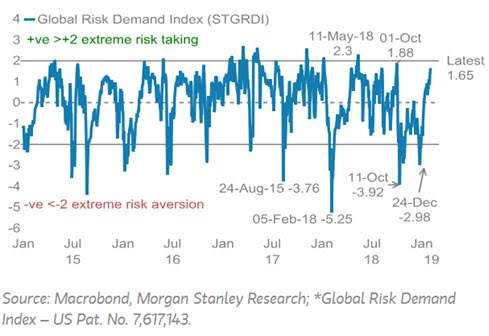
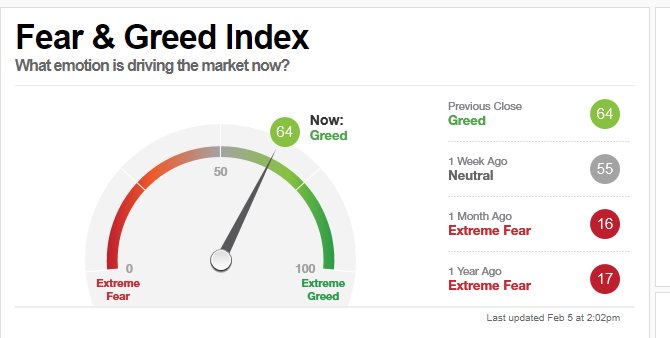
Why have risk markets rallied so strongly to begin 2019? Because the Powell U-Turn incited a reversal of short positions and the unwind of bearish hedges and speculations. Derivative-related (“dynamic”) selling – that had been rapidly gaining momentum – reversed course and became aggressive buyers. Market momentum then incited buying from the enormous trend-following/performance chasing Crowd. Who can afford to miss a rally? Certainly not the global leveraged speculating community, with many at risk of losing assets, incomes and businesses.
Why have safe haven assets performed so well in the face of surging equities and corporate debt? Because current Market Structure is inherently unstable and increasingly prone to an accident. Today’s buyers of Treasuries, bunds and JGBs are less concerned with January/Q1 equities and junk bond returns, keenly focused instead on acute global market instabilities and the inevitability of a systemic market liquidity event. I would further argue that this dysfunctional market dynamic recalls the destabilizing rally in Treasuries and agency securities in 2007 and well into 2008. This market anomaly stoked end-of-cycle speculative Bubble excess and exacerbated systemic fragilities.
When risk markets advance, news and analysis invariably focus on the positives – an expanding U.S. economy, prospects for a trade deal with China, buoyant profits, a backdrop of ongoing exciting technological advancements, perpetual low interest rates, endless loose financial conditions, etc. With markets advancing, mounting risks are easily disregarded. “Deficits don’t matter.” Debt concerns are archaic. Market Structure is a nothing burger. Best to ignore escalating social, political and geopolitical risks. The unfolding clash between the U.S. and the rising China superpower – it’s nothing. An increasingly fragmented and combative world – ditto.
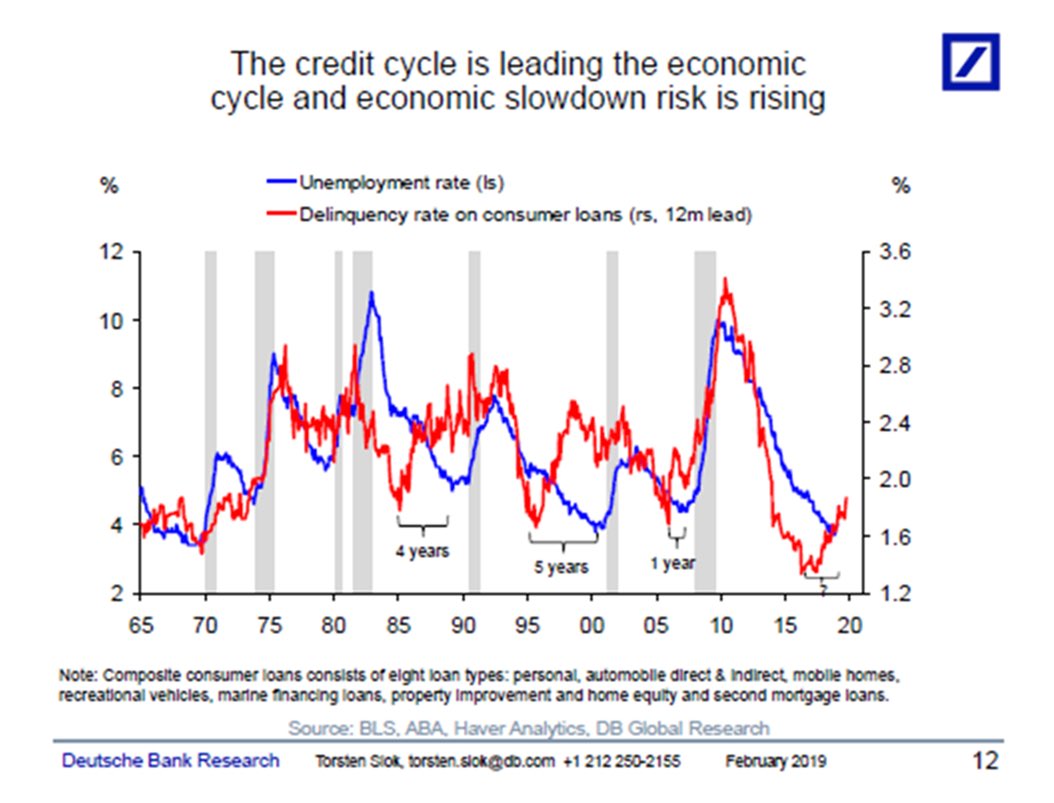
As we saw in December, sinking markets direct attention to an expanding list of troubling developments. Years of inflating securities prices seemed to demonstrate that so many of the old worries were unjustified – none really mattered. The problem is that many do matter – and some tremendously. The current extraordinary backdrop has all the makings for a decisive bearish turn in market sentiment that would create a problematic feedback loop within the real economy – domestically and globally.
I’ll highlight an issue that has come to be easily dismissed – yet matters tremendously. Zero rates and QE were a policy experiment. The consensus view holds that the great success of this monetary exercise ensures that QE is now a permanent fixture in the central banking “tool kit”. The original premise of this experiment rested on the supposition that a temporary boost of liquidity would stimulate higher risk market prices and risk-taking with resulting wealth effects that would loosen financial conditions while stimulating investment, spending and income growth throughout the real economy. The expectation was that a shot of stimulus would return the real economy back to its long-term trajectory.
History teaches us that monetary inflations are rarely temporary. Travel down that road and it’s nearly impossible to get off. Dr. Bernanke, the Federal Reserve and global central bankers never contemplated what a decade of unending monetary stimulus would do to Market and Financial Structure. Most – in policy circles and the marketplace – believe beyond a doubt that monetary stimulus was hugely successful in resuscitating economic growth dynamics.
But it’s on the financial side where consequences and repercussions have been fatefully neglected. It’s in the financial world where a decade of QE, zero rates and central bank market backstops imparted momentous structural change: the colossal ETF complex, the passive “investing” craze, quantitative strategies, algorithmic and high-frequency trading, a proliferation of derivative trading, leveraging and trend-following speculation on a global basis – to list only the most obvious. Along the way, aggressive monetary stimulus had much greater inflationary effects on risk markets than upon real economies. This ensured a continuation of aggressive stimulus – and only deeper market Bubble maladjustment.
For a month now, markets have celebrated the view that Chairman Powell (and global central bankers more generally) will not be attempting to “normalize” monetary policy. No Fed-induced tightening of financial conditions, along with no fretting the new Chairman’s commitment to the “Fed put.” Lost in all of this is recognition that a decade of experimental monetary stimulus has failed. Global finance is much more fragile today than prior to the 2008 crisis – the global economy more imbalanced and vulnerable.
Never has it been so easy to speculate – equities and corporate Credit alike. Never has corporate Credit availability – and financial conditions more generally – been governed by the interplay between the ETF complex, derivatives strategies and a distressed global leveraged speculating community. The Powell U-Turn unleashed another round of speculative excess. Right in the face of faltering global growth, I would argue this bout of speculation is especially precarious. And when the current “risk on” gives way to reality, maladjusted Market Structure will ensure liquidity issues on a scale beyond December.
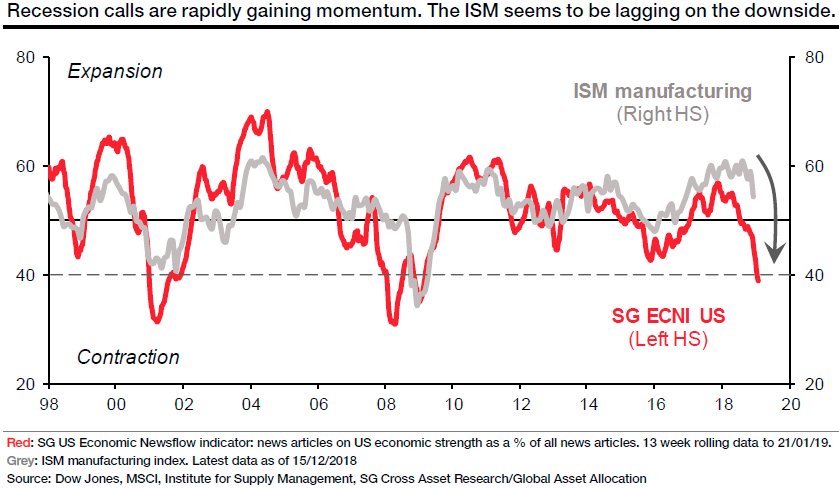
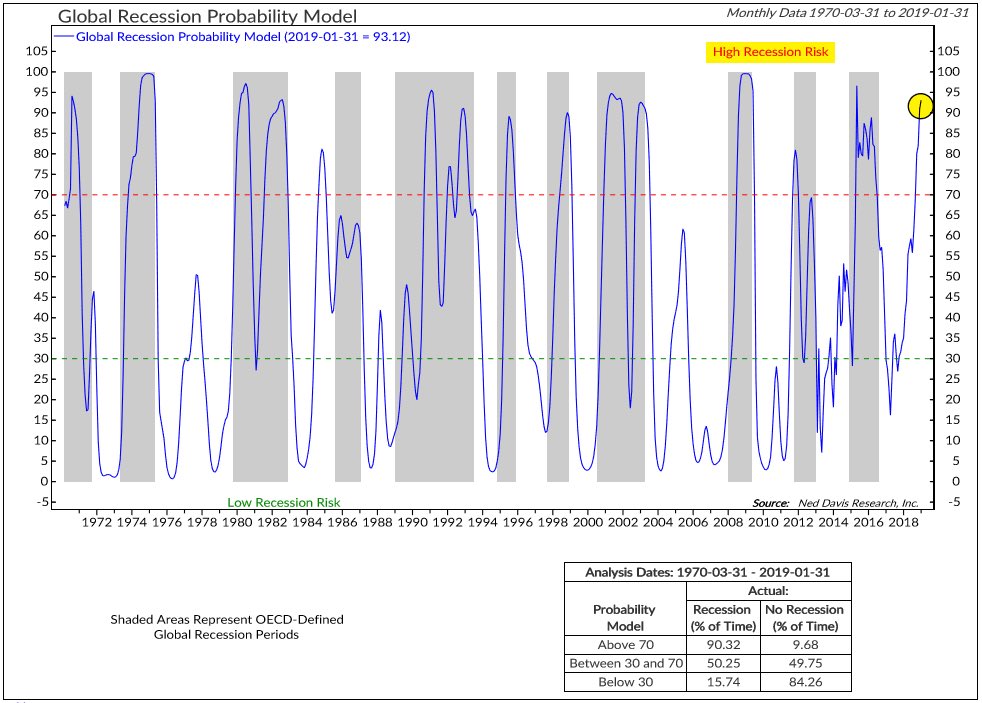
“This is deflation, the amazing lurch toward recession despite QE…,” read the opening sentence of a friendly email I received last week. Yet I remember all the talk of deflation after the 1987 stock market crash. It became even louder in 1990 – then again in ‘97/’98. Deflation was the big worry with the bursting of the “tech” Bubble and then with corporate debt problems in 2002. Global central bankers have been fighting deflation now for a decade since “the worst crisis since the Great Depression.”
For a long time now, I’ve argued that Bubbles are the overarching risk. The “scourge of deflation” was not the ghastly plight to vanquish with interminable “whatever it takes.” Rather, deflation is a fateful consequence of bursting Bubbles – Bubbles inflated in the process of central bankers fighting so-called “deflationary forces.” Now, after thirty years of unending global Credit growth, activist central banking and egregious financial speculation, Bubble risk has never been so great. “The amazing lurch toward recession” and financial dislocation specifically because of a failed experiment in QE and inflationist monetary management.
But I’ll conclude with Market Structure. Global markets have turned even more synchronized during this upside convulsion. This increases already highly elevated risk come the next downturn. And I wouldn’t expect much in the way of diversification benefits from Treasuries, bunds and JGBs. It’s worth mentioning that Italian 10-year yields were up 31 bps in two weeks (spreads to bunds widening 41 bps!). With Italian and European economic prospects seeming to darken by the week, European corporate debt came under some pressure this week. Germany’s DAX equities index fell 2.4%, and Japan’s Nikkei dropped 2.2%. And one could almost see fissures start to appear in EM currencies, equities and bonds. Eastern European currencies were notably weak, while the South African rand, Brazilian real and Argentine peso were all down about 2%.
http://creditbubblebulletin.blogspot.com/2019/02/weekly-commentary-delusional.html
