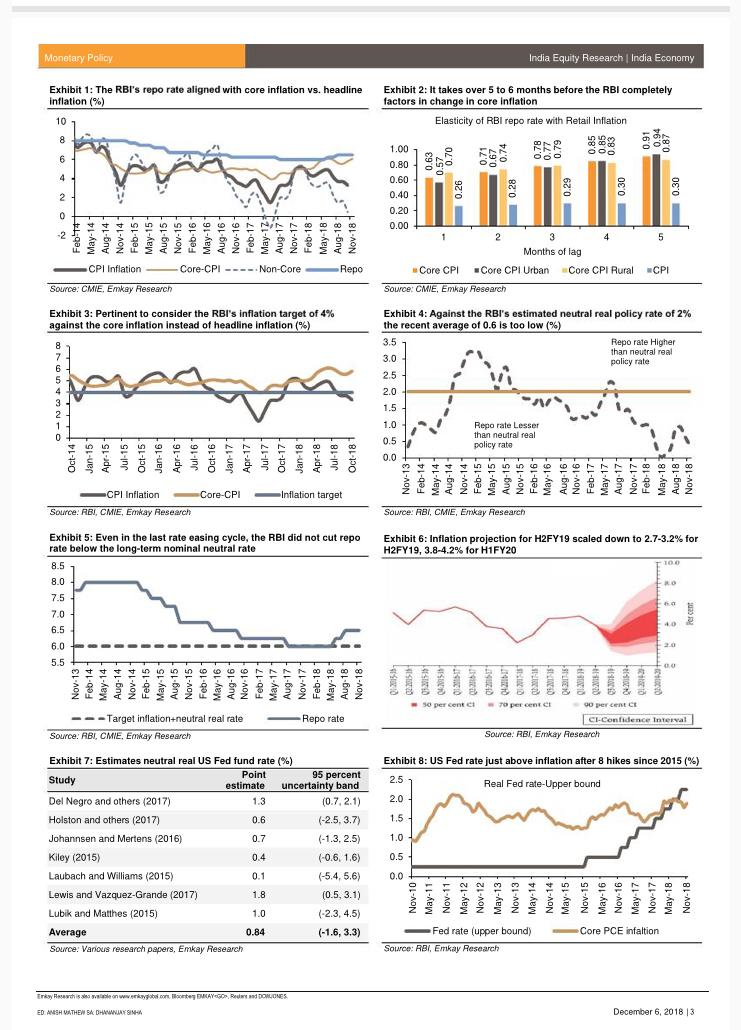
RBI should shift its focus to CORE INFLATION

Dhananjay writes “The persistent focus of the RBI and the markets on headline inflation is a misnomer in the context of monetary policy management. It is high time that the RBI starts articulating its stance based on core inflation. Given the sticky nature of core inflation, it is unlikely that the RBI will change its “calibrated tightening” stance in a hurry unless unanticipated negative demand shocks lead to a 100-200bp decline from the current 6% plus. As of now, most lead indicators cited by the RBI suggest an upside risk to core inflation.”

Some interesting charts from EMKAY report

My two cents

I look at only one set of data to determine the trajectory of interest rates and that is the difference of deposit  and credit growth rate. The credit growth YOY stands at 13% and deposit growth stands at 8% YOY. This is unsustainable for a long period of time but for time being RBI is filling this gap by doing aggressive Open market operation. Reserve money is getting created out of thin air by monetizing the Govt deficit (worst quality of credit).

The gap between deposit and credit will only get narrowed when saver ( local or global, investing through banks, MF or insurance ) feels the rates are high enough to postpone consumption in favor of saving and that is when this difference gets narrowed and system equilibrium shifts to lower inflation and finally lower rates.

The lack of deposit growth is telling RBI that rates are not high enough to substitute consumption with savings.

The sand is shifting

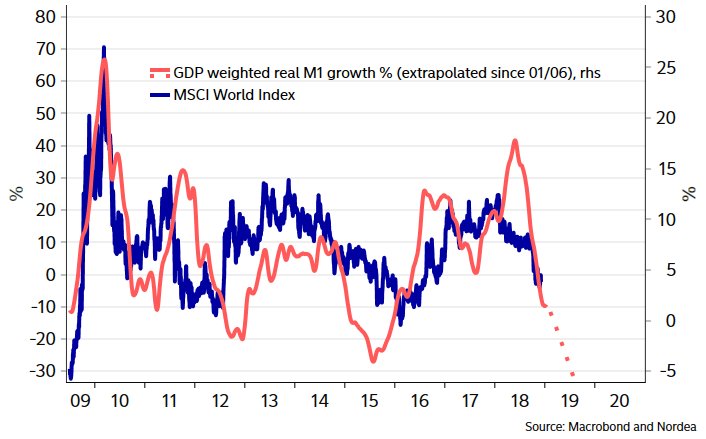
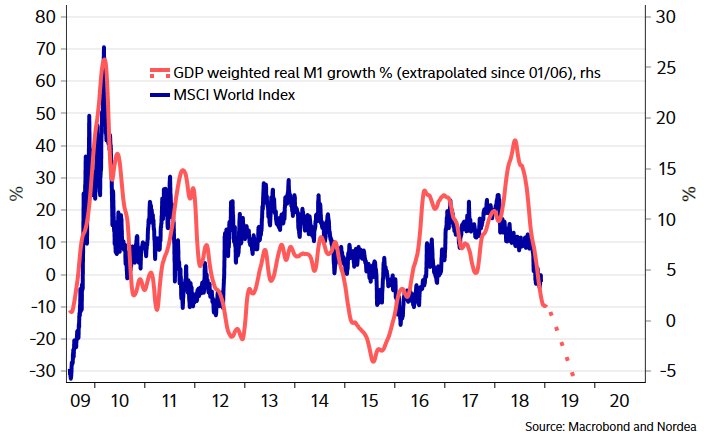
Throw those projections out. If you want to know where equity markets are headed , then look no further than the chart below which shows the correlation between M1 and MSCI world Index.Central banks probably need to do something to turn around real M1 growth, otherwise MSCI World will face another tough run in H1 of 2019.Do you think CBs will turn around? Oh yes they will..


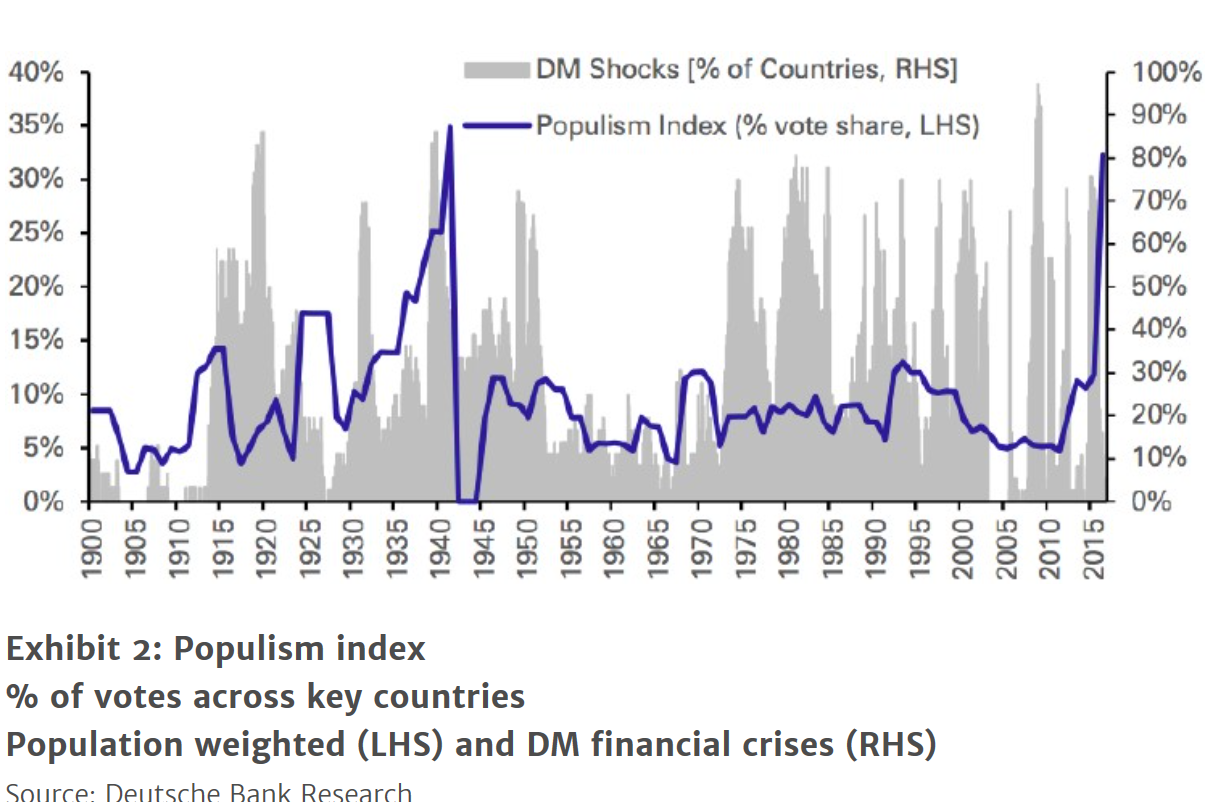
If we compare the current debt super-cycle to the previous one, which ended with the outbreak of World War II in 1939, 2007-09 were similar in nature to 1929-32, and the phase we are going through now is similar to 1935-39, where a sharply rising gap between poor and rich led to a monumental rise in monster like Adolf Hitler

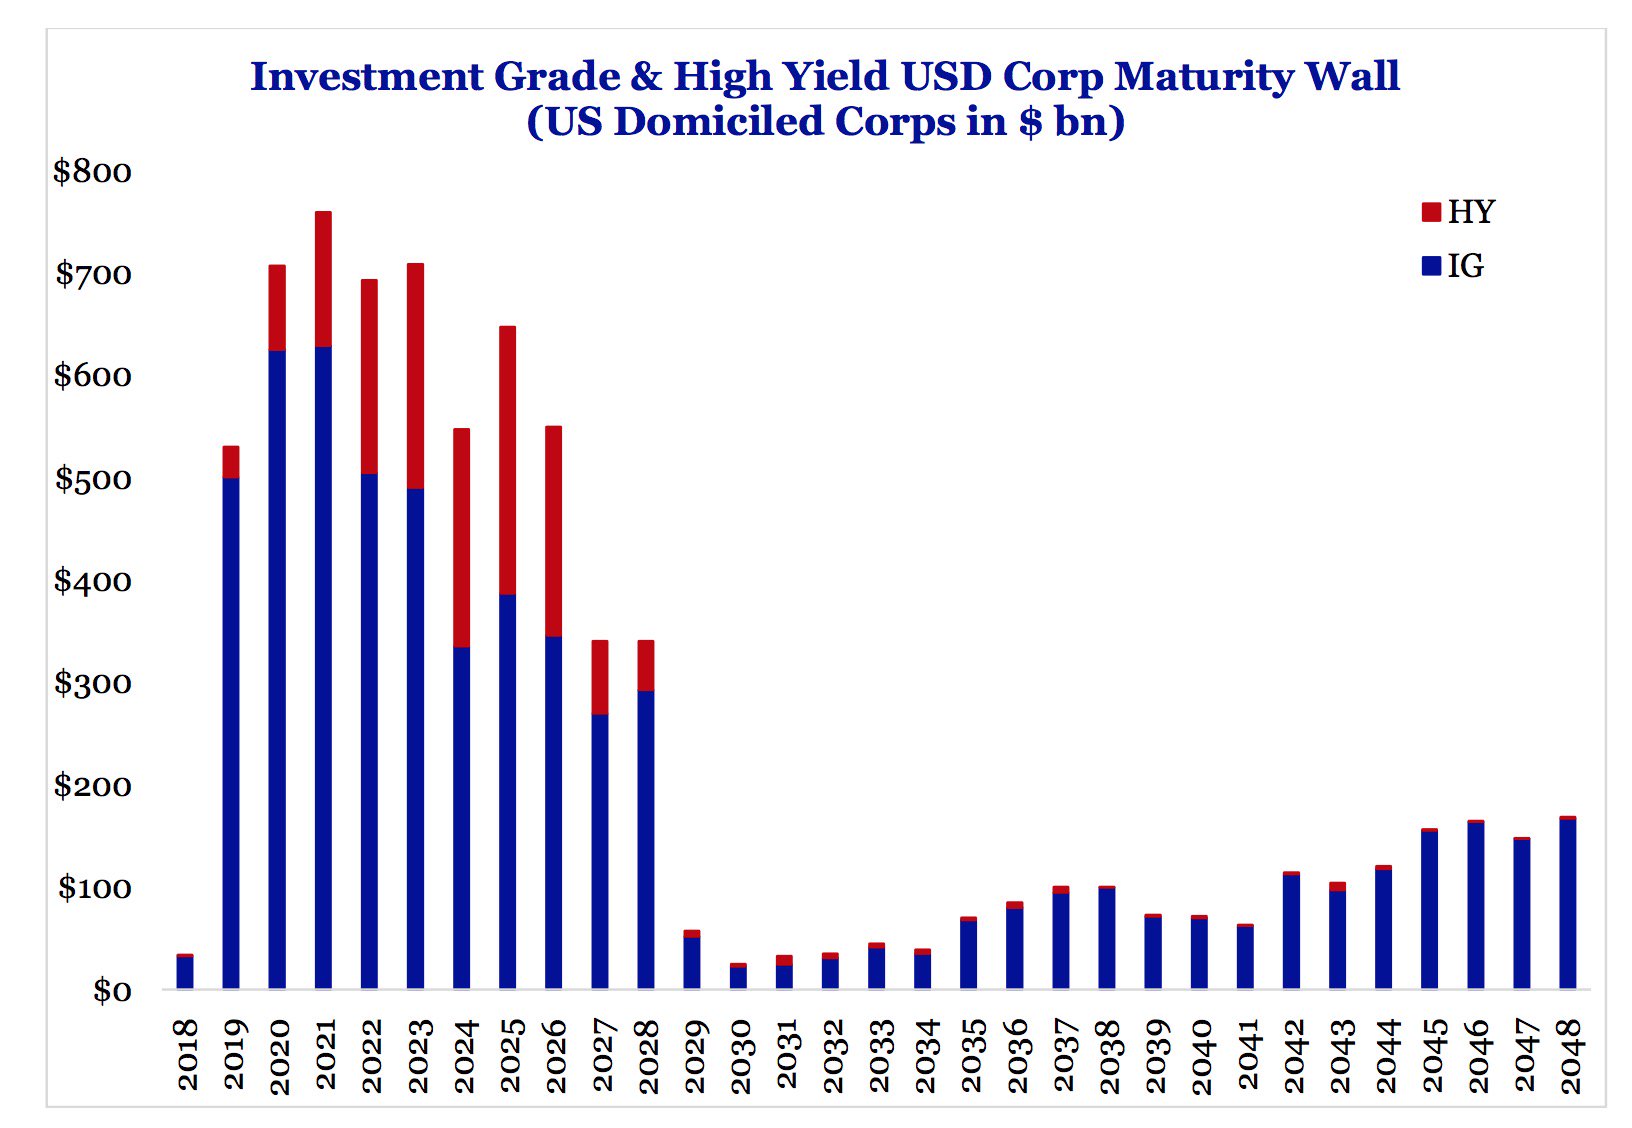
It looks like the US credit market is about to hit the wall. US wall of maturity is around 2020 to 2022, according to calculations by SRP boxing central bankers into the corner.

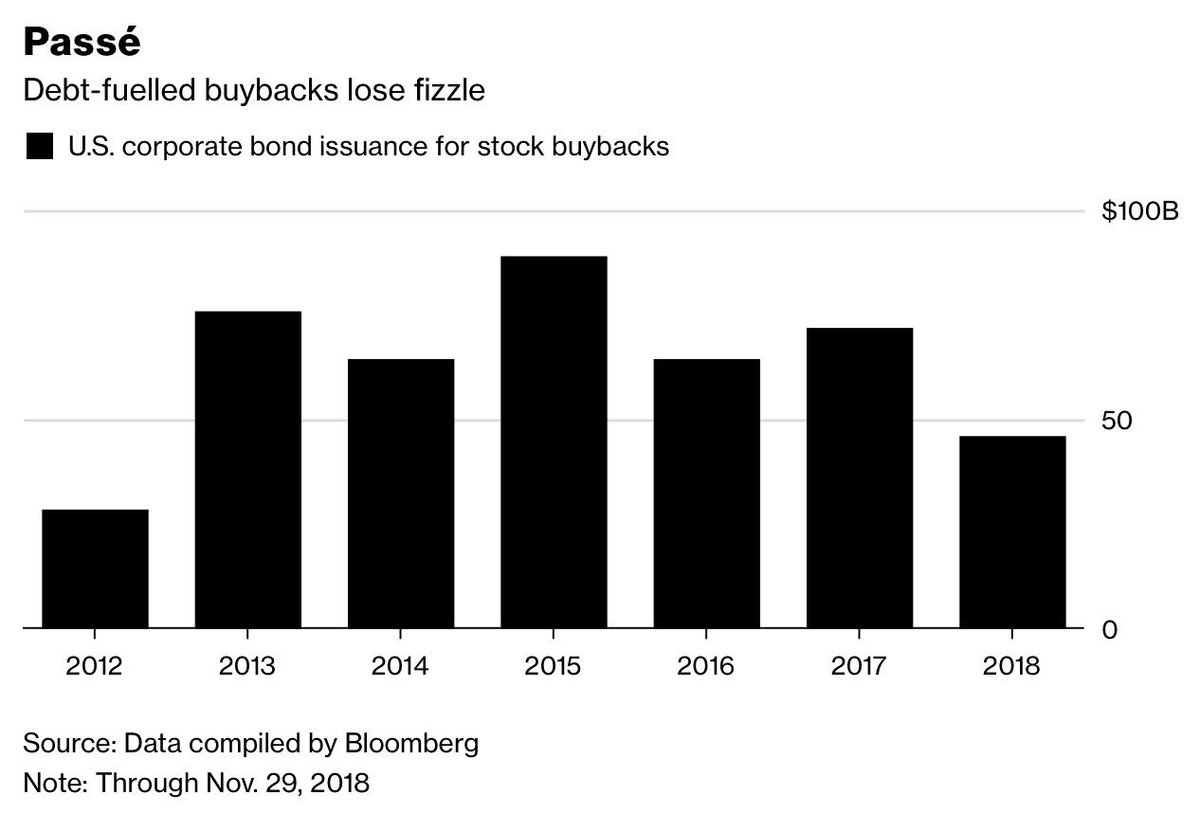
Debt-fuelled buybacks under threat as creditors get demanding ask GE or GM. Companies no longer ‘happy to use cash’ towards payouts. This was the significant tailwind for US stock market which is now under threat.

My two cents
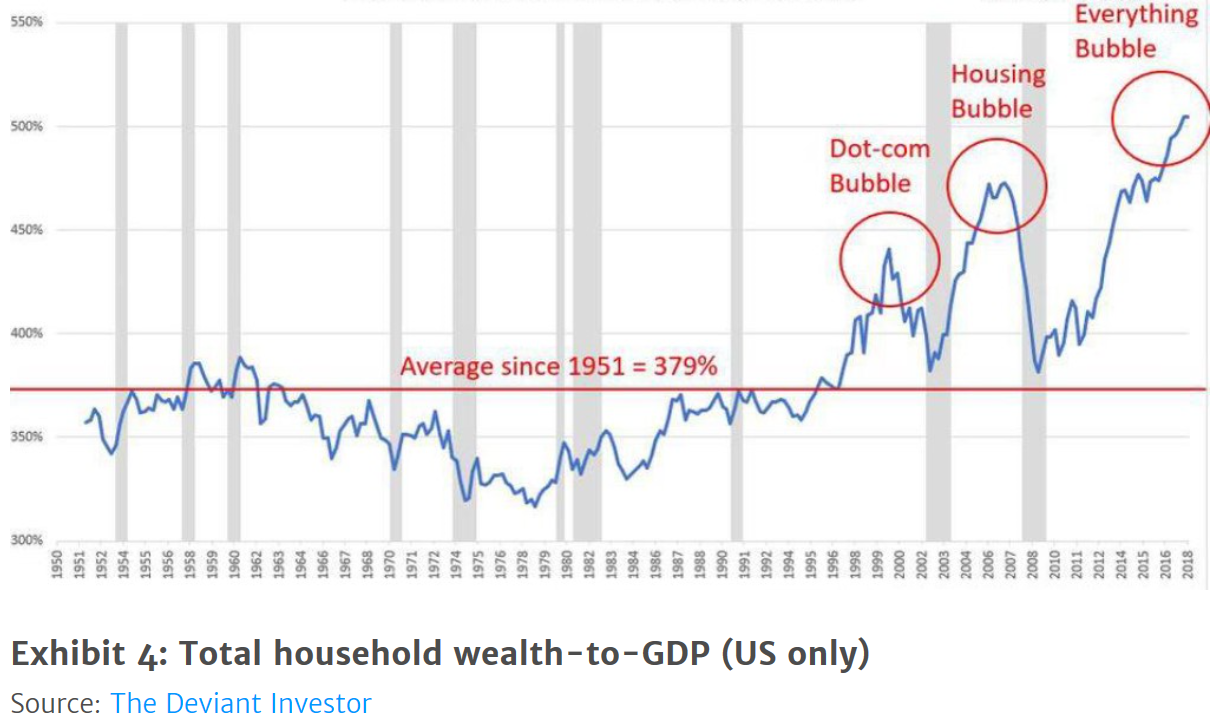
The charts above are signaling that investment landscape is shifting. I can easily put the blame on central bankers for cutting the rates so low that saving money amounted to stupidity and borrowing to spend or buyback your own share was seen as the right thing. This led to higher level of indebtedness at household and corporate level along with rise in asset prices. Poor don’t have assets,so they were left behind in this orgy of asset bubble as seen below which is leading to rise in populism ( seen those yellow vest protests)

what will happen when this Everything Bubble burst’s? any guesses

Charts That Matter- It’s Time for GOLD

This is the special edition of charts from Indiacharts monthly long short report.

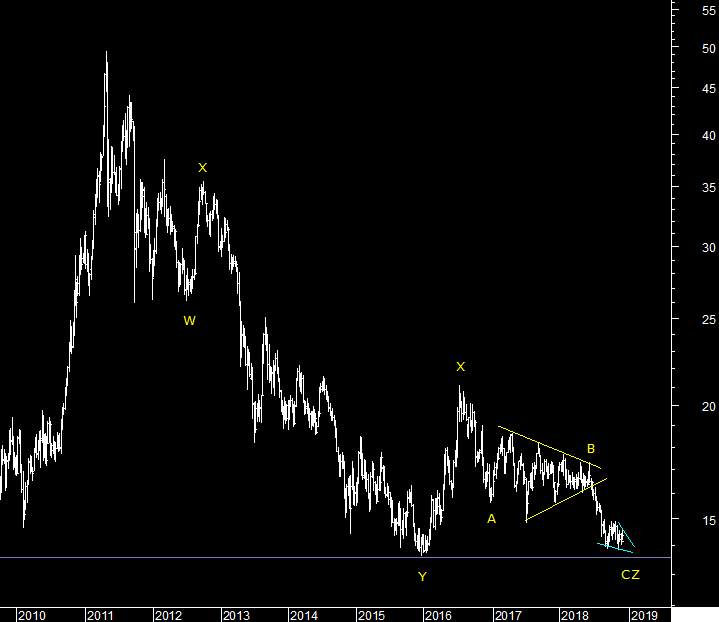
Below is Gold chart in US Dollar.

Silver is at a near double bottom at 13.76-14$ and waiting for a price confirmation. Once prices breakout then we should see silver join gold on the upside and go back to test the high near X near 21$ to start with.

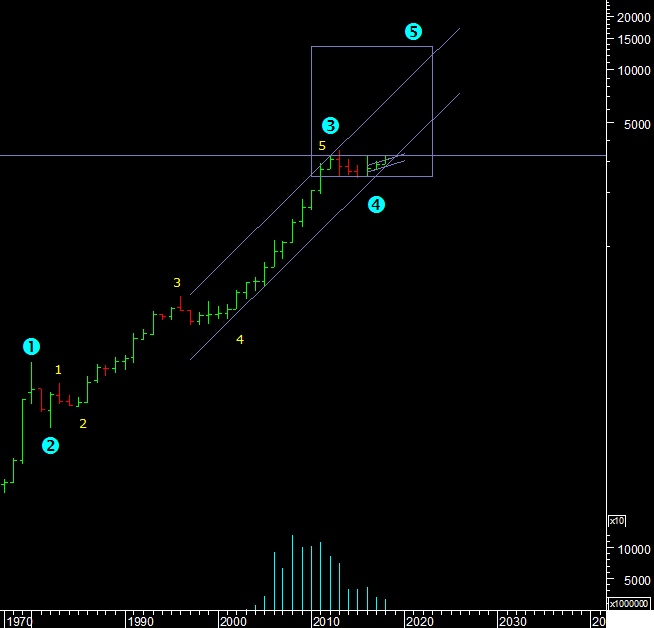
Rohit writes….So if Gold comed is going to kick off what does Gold Mcx look like long term? The MCX chart back dated to 1970 is here. The chart shows that we completed wave 4 long term in 2015. Since then this is the third year the Gold is closing positive even as the gains are small. The prices have held up much better in rupee terms because of the USDINR going up in 2013 and then again this year, the currency devaluations biggest beneficiary is gold. Now 32500 and 35075 are the two levels to breakout above. Where is 5=1 from the low in 2015? It is above 80,000 rupees. This is a yearly chart.

Conclusion
In short we maybe looking at down dollar and up Commodities for the next few years if this plays out. Stay tuned. But we are certainly looking at gold taking a head start as seasonality has kicked in, December is the best time for Gold to bottom out based on historical evidence. If the H&S bottom is done then this maybe the last chance to get in at these levels.

My two cents

I have a bias towards Gold simply because it cannot be printed at will and is a hedge against political stupidity. I do think a big rally is coming in precious metals but I am not sure Dollar rally is over as yet.

For full report subscribe
https://www.indiacharts.com/icjpages/index.php/subnow/levels


What is the yield curve forecasting?

Macromania explains….It’s well-known that in the United States, recessions are often preceded by an inversion of the yield curve. Is there any economic rationale for why this should be the case?

Most yield curve analysis makes reference to nominal interest rates. Economic theory, however, stresses the relevance of real (inflation-adjusted) interest rates. (The distinction does not matter much for the U.S in recent decades, as inflation has remained low and stable). According to standard asset-pricing theory (which, unfortunately for present purposes, abstracts from liquidity premia), the real interest rate measures the rate at which consumption (a broad measure of material living standards) is expected to grow over a given horizon. A high 1-year yield signals that growth is expected to be high over a one-year horizon. A high 10-year yield signals that annual growth is expected, on average, to be high over a ten-year horizon. If the difference in the 10-year and 1-year yield is positive, then growth is expected to accelerate. If the difference is negative–i.e., if the real yield curve inverts–then growth is expected to decelerate.

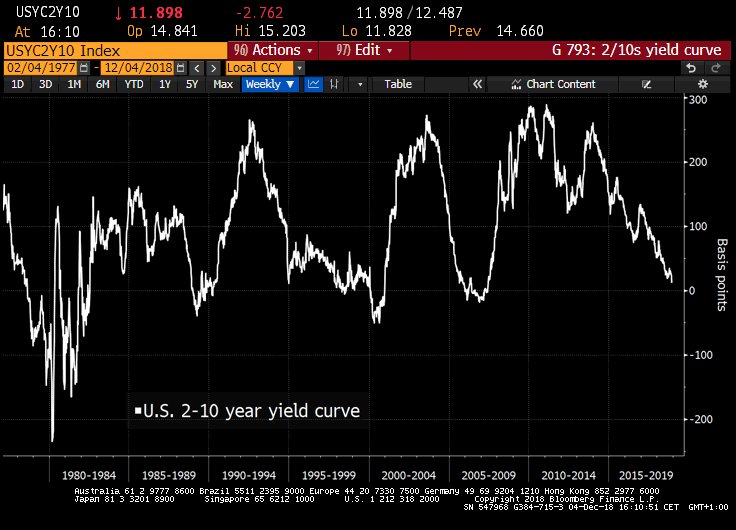
(Only 12bps to go. US 2s/10s yield curve drops to 12bps, lowest since 2007.)
What is the economic intuition for these claims? One way to think about this is in terms of Friedman’s Permanent Income Hypothesis, which states that an individual’s desired consumption expenditure today should depend not only on current income, but the likely path of his/her income over the foreseeable future. The logic of this argument follows from the assumption that people are willing and able to smooth their consumption over time, given their expectations over how their incomes are likely to evolve over time. For example, if people expect their income to be higher in the future, then they will want to consume more today in order to smooth out their consumption. They can attempt to do so by saving less (or borrowing more). If a community is collectively “bullish” in this sense, desired consumer spending should rise in the aggregate, and desired saving should fall, leading to upward pressure on the real interest rate.

Alternatively, suppose that firms suddenly turn bullish on the likely returns to capital spending. Then the resulting increase in the demand for investment financing should drive real interest rates upward. In this case as well, a higher real interest rate signals the expectation of a higher rate of economic growth. If individual expectations over future prospects are correct more often they are incorrect, then higher real interest rates today should be correlated with higher future growth rates.

So, in theory at least, an inverted yield curve does not forecast recessions–it forecasts growth slowdowns. Nevertheless, there is a sense in which an inverted (or even flat) yield curve can, in some circumstances, suggest that recession is more likely. Here’s the basic idea.

Consider an economy that grows over time, but where growth occurs unevenly (i.e., the economy alternates between high- and low-growth regimes). Imagine, as well, that the economy is occasionally buffeted by negative “shocks”—adverse events that occur at unpredictable moments in time (an oil price spike, a stock market collapse, etc.). It seems clear enough that in such an economy, recessions are more likely to occur when a shock of a given size occurs in a low-growth state as opposed to a high-growth state.

Now, as explained above, suppose that an inverted yield curve forecasts a deceleration in growth. Then the deceleration will entail moving from a higher growth state to lower growth state. Suppose this lower growth state is near zero. In this state, growth is now more likely to turn negative in the event of a shock. In this way, an inverted yield curve does not forecast recession; instead, it forecasts the economic conditions that make recession more likely.

My two cents

I think something is triggered when yield curves invert, or some recessionary force triggers an inverted yield curve,or maybe the answer is so simple as central banks will raise rates until they cause a recession. The graph above suggests US Federal Reserve would do well to stop raising rates now and see what happens. They seem on course to repeat the previous cycles. The elephant in the room this time is US fiscal deficit which is set to touch a trillion in a year and if US were to attract worlds saving to fund this deficit then they need higher rates and that complicates the picture.
The ART of Defaulting

Niels Jenson writes in this month Absolute return letter….

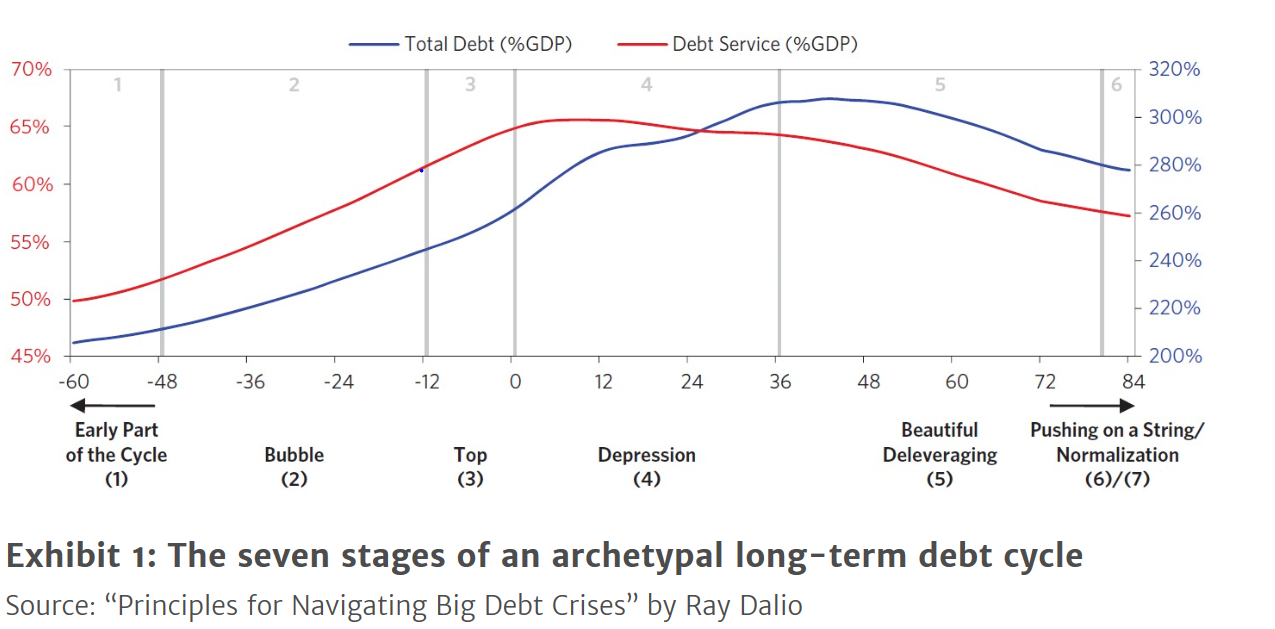
Three conditions are typically prevalent during the bubble stage (see chart below)
1. Debt grows faster than income.
2. Equity markets rally.
3. The yield curve flattens.
All three conditions have been prevalent in recent years. I should also point out that monetary authorities don’t always play ball at this stage of the debt cycle. Where they should seek to constrain the bubble, they often inflate it instead by being far too lenient.

But debt and GDP grows more or less in line during the early stages of debt super-cycles. As the bubble in stage 2 gets bigger and bigger, it takes more and more debt to deliver a dollar of GDP growth. As you near the end of the bubble stage, the debt-to-GDP ratio, which was about 1:1 earlier on, changes dramatically. It now takes about $5 of additional debt to generate a dollar of GDP growth. In some of the largest economies in the world, and that would include both China and the United States, the ratio is now 0.20-0.25; i.e. we are not far from hitting the proverbial wall.
Borrowings eventually peak (stage 3), and depression follows (stage 4) which Ray, as mentioned earlier, defines as a dive in GDP of 3% or more. All the debt cycles that he reviews in his book go through a slump in GDP of that magnitude or more.
Deleveraging (stage 5) follows, which Ray calls Beautiful Deleveraging. He assumes (which is almost always the case) that the stimulation offered by monetary authorities is powerful enough to offset the deflationary forces. In practice, this is done by providing ample liquidity and credit support.
Most of the time, that is it. Stage 5 marks the end of the debt cycle. Conditions normalise, and a new cycle can commence, but that is not always the case. Every now and then, consumers and companies don’t react to central bank policies the way the theory books prescribe. Consequently, monetary policy becomes inefficient.
This was a condition first recognised by central bankers in the 1930s, and they even coined a phrase to describe it: Pushing on a String, they called it. When that happens, you have come to the end of the debt super-cycle.

Read The full letter below

https://www.arpinvestments.com/arl/the-art-of-defaulting#.XAaKLVsI0Cw.twitter

Interview with Half Man, Half-God

Marko Kolanovic is the global head of macro quantitative and derivatives research at JPMorgan Chase & Co.His star, in fact, has reached such heights that CNBC sometimes identifies him in its chyron as “Half-Man, Half-God.

Some interesting quotes from his interview with Bloomberg

I do tend to be a more contrarian person who looks at things that people aren’t looking at right now—which is good and bad. It’s good because you can uncover things that nobody thought of, and they become very relevant. The bad is that you may be sometimes looking too far out, and then it’s not relevant. If most people don’t look at something, chances are it isn’t going to be relevant very soon. “Too early” sometimes also means “wrong” in finance. If you’re just going to be stating consensus, and a trend follower, you’re not adding much value. The proposition of being a bit more out-of-the-box contrarian is more risky, but it also differentiates.”

There’s this fragility in the marketplace that came with the new structure of liquidity, with electronic market-making, computers, and growth in passive. Passive assets and quant assets will grow, and computers and AI will have a bigger role in ­market-making. At some point that’s going to end up badly—most likely when the next recession hits. Some of the problems around computerized liquidity are going to be fully exposed, and it may really deal a blow to investors and markets overall. Not that we are forecasting it with a certain timeline, but more that investors should have it in the back of their minds.

There’s more algorithmic trading, where algos are going through headlines or sorting through earnings statements or going through social media in real time and trading. What are the consequences for investors?
We’re seeing reaction time get shorter and shorter for releases, which can also incur costs or take advantage of slower human investors. There are signs of potential abuses with social media posts and headlines. That’s going to get worse and worse and be more of an impediment for human investors to make money. It’s going to cause more confusion in the marketplace.

https://www.bloomberg.com/news/articles/2018-12-01/what-marko-kolanovic-is-looking-at-now

Bond Market Daring FED to raise the rates

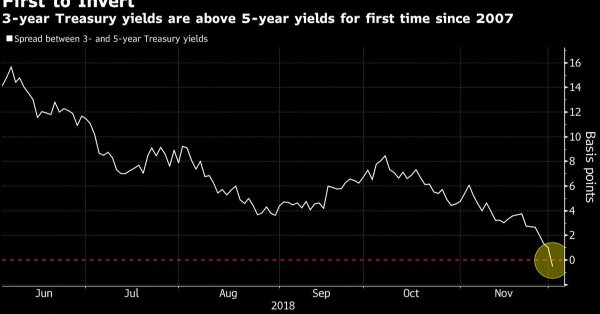
US treasury 5 year yield fell below US 2 year bond yield inverting the yield curve. Not a good sign for Us economy but as can be seen in the chart below stock market historically has continued to rally for 2 years after this inversion.

US treasury 3year over 5 year also inverted. Danielle Di Martino writes ” Courage of the Fed to raise rates on December 19 being put to the test by the market.”

US Treasury curve for 10 year also spells trouble as 2s/10s gap moved within ~14bps of going negative. If the Fed moves ahead with a 25bp hike in this month FOMC meeting, as is widely expected, the 2s/10s yield curve could easily outright invert.

if the inversion was not enough then Dr Copper also retraced all of the post US-China “truce” gains. Speaks volumes.

My two cents

Bond market is getting worried and Dr copper is not far behind in signaling that all is not well. There is no more inventory restocking led GDP to be created to beat the tariffs. It is early days but I think capital has started rotating back into Gold and US bonds as an insurance policy in spite of continued dollar strength. Any dollar weakness at this level will lead to some of this money finding its way into beaten down Emerging Markets

India’s GDP growth slows Down

Nirmal Bang comments upon India’s “Q2FY19 GDP Growth which Slowed down to 7.1%”

GDP growth for Q2FY19 stood at 7.1% YoY down from 8.2% in the previous quarter despite a relatively low base of 6.3% in 2 Q2FY18. This was significantly below our estimate of 7.6% and consensus estimate of 7.5% Industrial growth was below our expectation as manufacturing grew 7.4% YoY against our estimate of 8.5% YoY, while the mining sector declined 2.4% YoY. On the services side, the downside surprise largely came from government spending reflected by the public administration and defence services growing at 10.9% YoY,slower than we had anticipated. Agricultural growth at 3.8% YoY was also a tad below our estimate. Private consumption grew 7.0% YoY, down from 8.6% in the previous quarter , and just a tad higher than 6.8% a year ago.

On a positive note, capex spending remains supportive with gross fixed capital formation rising 12.5% YoY, up from 10% in the previous quarter and 6.1% a year ago*** The capex spending in our view is largely government supported, and is likely to slow in the months ahead as cut backs in capital expenditure are implemented in a bid to meet the fiscal deficit target. Data released separately showed that the fiscal deficit for April – October stood at 103.9% of budget, compared to 96.1% a year ago. The shortfall is on account of lower tax and divestment revenue.
Divestments have witnessed a pickup in November,yet indirect taxes may not receive the expected boost as growth slows Ahead of elections, revenue spending is likely to witness a pickup to support growth while capex spending slows. With the revenue shortfall and slowing growth warranting higher revenue expenditure, we see increasing risks of fiscal slippage in FY19

With Q2FY18 GDP growth coming in below our forecast we have cut FY19 GDP growth to 7.1%. With growth slowing and inflation below the RBI’s 4% target, an extended pause is likely in FY19, with a move towards more accommodative policy by mid FY20 as the Fed also eases its rate hiking cycle. Our FY20 growth forecast also stands
at 7.1%, a tad lower than our earlier estimate of 7.2%

What’s Keeping Food Prices Low?

Via PL Blog

In an economy which was battling food inflation in double digits until a few years ago, demand was outpacing supply, leading to very high prices of agricultural commodities. Farmers responded to this by increasing supply and were aided by technological advancements and agricultural reforms. The result is that supply growth appears to have outstripped the pace at which demand has increased.Food and beverages, including cereals, pulses and vegetables comprise 47 percent of the consumer price index (CPI). This sub-component of inflation was negative 0.8 per cent and continues to surprise many.
Over the years, India has seen many a protest over rising prices of food items like onions and tomatoes. However, over the last two years, the situation has been dramatically different. Prices of food items have increased too slowly at times, leaving policymakers confused and farmers distressed.
This is strange because almost everyone was predicting a rise in food inflation once the government – possibly as a pre-election sop –announced MSPs (minimum support prices) for several crops. Everyone, therefore, expected a surge in agricultural prices. Instead, prices continued to climb down. And the question ‘why’ was on the lips of many.
Prices of 12 among the 14 kharif crops have ruled below their minimum support prices (MSPs) since arrival of the summer crop began, and in case of five of these crops namely paddy, tur, groundnut, niger and ragi, the prices have been on a continuous decline through the season.

Reason 1: Supply
Kharif crops are almost at 141.59 million tonnes- 0.86 million tonnes higher than last year. In particular, production of rice, sugarcane and oil seeds is seen higher than last year. The output of key pulses, which has surged over the last few years, remains slightly lower than last year.Domestic production of sugar has risen to almost record levels. Coarse cereals seem to be the worst affected. Their prices are nearly 25 -30% per cent lower than the MSPs announced by the government. The same phenomenon is affecting onions as well.
Even in dairy, there is major distress, both locally and internationally. Milk prices across the country have dipped by over 50 per cent in the last few months and milk procurement has also come down. The artificial milk glut is due to 1.6 lakh tonnes of unused skimmed milk powder generated by the various dairy cooperatives across the country. Internationally there have been disastrously high stocks of powder with farmers in New Zealand , US and Australia suffering.
Apart from the large supply, several other factors too appear to be responsible for depressed agricultural prices.
REASON 2: International Prices
Lood prices prevailing globally could be an indirect factor though linkages are not across and are weak in nature. Depressed commodity prices have restricted the market for agricultural exports for several years. A shift in consumption patterns and consumer food preferences could also be contributing to the low food inflation. Globally, the demand for agricultural commodities has started to weaken, and this trend is expected to persist over the coming decade.
According to the recently released ‘OECD Agricultural Outlook 2018-2027’. production has grown strongly across commodities. In 2017, production reached record levels for most cereals, meat types, dairy products, and fish. On the other hand, as demand growth continues to decelerate, prices of agricultural commodities are expected to remain low.
According to the report, much of the impetus to demand over the past decade came from rising per capita incomes in China, which stimulated the country’s demand for meat, fish and animal feed. Whatever little growth is now expected in terms of food consumption, it will be due to population growth and higher per capita income, with sub-Saharan Africa and India likely to account for a large share of the additional food demand for cereals in the coming decade.
REASON 3: LOGISTICS ISSUES MEAN DISTRESS SALES
In India, every year, farmers lose Rs 63,000 crore because they are not able to sell their produce at a remunerative price. Horticulture farmers are the worst hit. While government celebrates a production boom, farmers see their produce going waste even before they reach market due to insufficient cold storage capacity, unavailability of cold storages in proximity to farms and weak transportation infrastructure. In absence of such infrastructure, produce is sold in Fruits and vegetables are, therefore, largely sold at local markets at a throwaway price.
REASON 4 : MSP doesn’t seem to be working
To address the long-standing demand of farmer organizations to fix minimum support prices (MSPs) at 50% over cost of production, , the centre in the budget presented in February announced two major policy decisions. Firstly, it promised that henceforth MSPs will be fixed to ensure at least 50% returns on production cost to farmers and secondly, it pledged to ensure effective price support-based procurement of pulses and oilseeds, going beyond the usual rice and wheat purchased by the government for the subsidized public distribution system.
Refer http://pib.nic.in/newsite/PrintRelease.aspx?relid=181467
In line with its budget promise, the centre announced a steep hike in MSP of kharif crops—at least 50% more than the cultivation costs—in July. In September, it followed up with an ambitious scheme named Pradhan Mantri Annadata Aay Sanrakshan Abhiyan, or PM-AASHA, to ensure those growing pulses and oilseeds benefit from higher MSPs announced by the government.
The minimum support price (MSP) policy was supposed to help the farmer and keep prices at least fifty percent higher than the cost. But it is just a price guarantee, not an assurance about quantity. Predictably, traders refused to pick up crops at their MSPs from farmers. The farmers desperate to sell must have agreed to sell them at any price. It is quite possible that the farmers resorted to distress sale, maybe at prices lower than what they used to get earlier because the traders just refused to pick up produce at the recently announced MSPs. Unless MSP is backed up by procurement – either by the trade, or commodity markets, or the government, the mere announcement of MSP has no meaning at all.
What’s more, government agencies are now offloading their procured stocks at lower than MSP to make space for fresh purchases, which is further depressing market prices for farmers.
Maharashtra came out with a policy of arresting if traders bought below MSP so it may be likely that traders resisted buying itself.
IMPACT
All this does not bode well for farm incomes. As farmers and villagers face parched lands, there may be increased migration to the cities closer to the summer months of 2019. This may mean lesser farm labor and then of course there is the issue of farmers not planting enough next two seasons – which means food inflation next year may be high – unpredictably maybe. This may create volatility in prices next year and with two consecutive near normal monsoons.
There is also the looming national election in May next year, and falling incomes in rural areas could become a major electoral issue – we will know soon enough!

https://www.plindia.com/blog/whats-keeping-food-prices-low/

Trade truce for Now

Diana Choyleva was had wrote few days back Trade truce in G-20 which I wrote in an article few days back http://worldoutofwhack.com/2018/11/29/g-20-is-there-a-temporary-truce-on-hand/

Now that we know that she has pulse of this matter she writes
As we expected, Xi and Trump called a truce after their productive dinner at G20
This is far from a breakthrough, but markets are likely to take the news well
The US will hold off on raising tariffs on Jan 1st, but will raise them to 25% if a deal isn’t reached in the next 90 days
Beijing’s statement fails to mention the deadline and strikes a more general tone
As we argued, China will ramp up its purchases of US goods
But for Washington, forced technology transfer, intellectual property rights and non-tariff barriers are key
We expect China to cede ground on the above, but its high-tech leadership ambitions are non-negotiable
The trade war is likely to morph into a tech war in 2019
For now, investors’ reluctance to see this as a fundamental shift in US-China relations should ensure at least a lukewarm welcome to the news

Danielled Lecalle  writes

The “agreement” between Trump and XiJinping is nothing more than a diplomatic ceasefire. China is unlikely to improve transparency and intellectual property protection and the US trade deficit has widened since January.”

My two cents

This is nothing more than kicking the can down the road and the statement by China and US post G-20 meeting does not even match is content…  but Hey who cares?. China has already cut down the margin for trading stocks, starting next week and Global fund managers like Pavlov dog will be raring to cover some lost alpha before the year comes to an end. 

Enjoy till it last